Corresponding relation between the result of real-time fluid analysis and estimated energy value of aftershock during drilling in WFSD
Abstract:
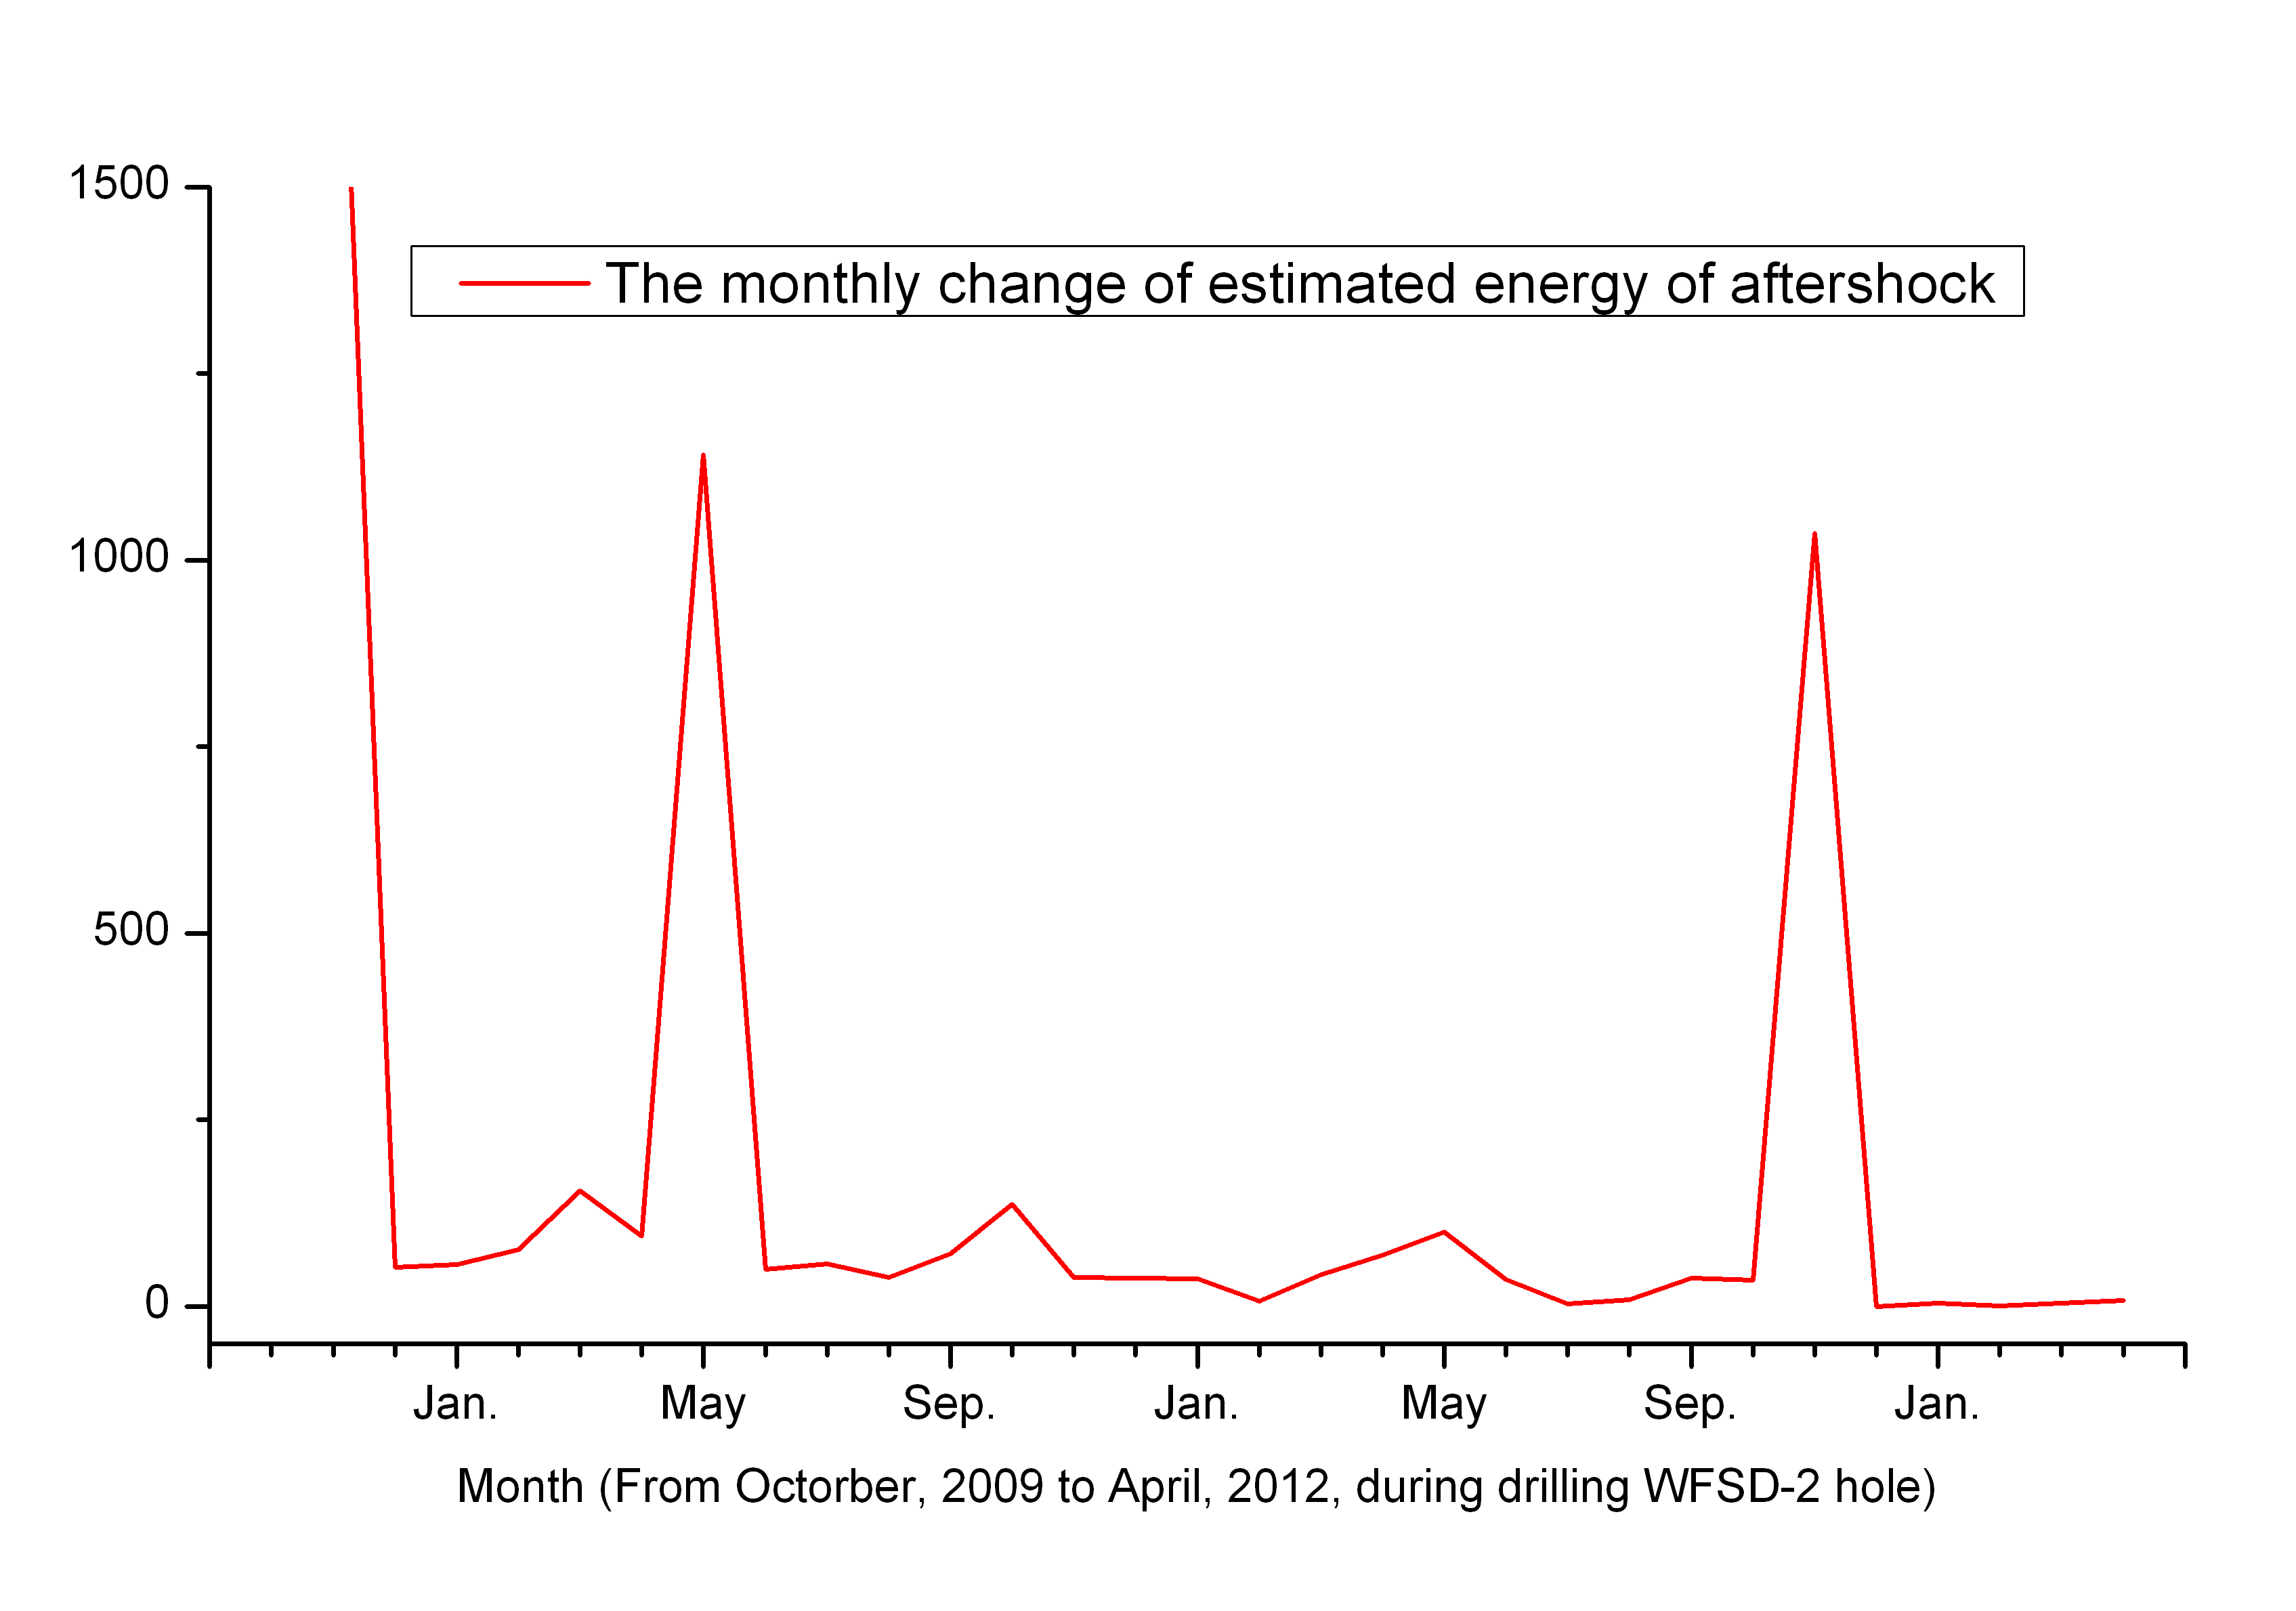
Due to a few actual reasons, such as no mud circulation, the period of real-time fluid analysis would shorter than that of drilling process. The actual period of fluid analysis in WFSD-2 hole is from October 14, 2009 to April 5, 2012, so the statistical analysis of the aftershock information and the magnitude effort were both considered during this period. According to the relationship between magnitude and seismic energy of earthquake, the monthly earthquake energy values were estimated. Estimation approach is based on the formula proposed by the seismologist Richter in 1953, in which the energy value of aftershock between Ms. 3.0 and Ms. 4.0 is defined as 1, that of aftershocks between Ms. 4.0 and Ms. 5.0 is multiplied by 31.6, and that of between Ms. 5.0 and Ms. 6.0 is multiplied by 1000. Then the monthly curve of estimated energy values is showed in Fig. (Monthly curve of estimated energy value of aftershock more than 3.0 during drilling WFSD-2. X-axis represents the month, Y-axis represents the estimated energy value).
We could find that some special corresponding periods through the comparison of fluid change and the energy estimated values of aftershocks from the Fig. and the poster (Fall Meeting AGU 2013, San Francisco, T23E-2645), which had showed the ratio curves of the minimum and mean value, the maximum and mean value over time. We can see that the curve of estimated energy value appears the two most obvious peaks, the period of which is consistent with that of fluid components ratio peaks. Moreover, the periods of the other two more obvious peaks of the estimated energy values appears in October, 2010 and May, 2011. The curve of fluid components ratio also shows two more obvious change just in the two same periods.