Tsunami Inundation Mapping for the Upper East Coast of the United States
Abstract:
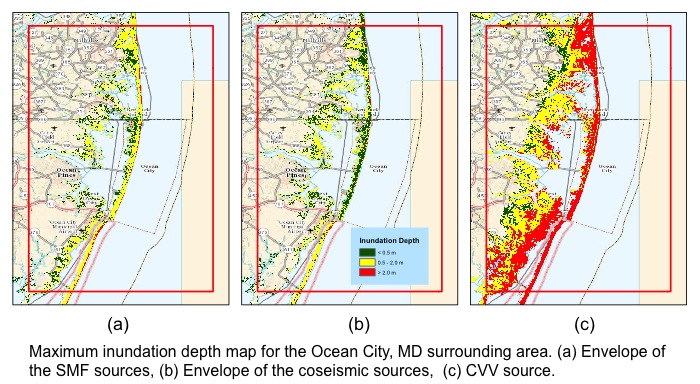
For this presentation, we discuss modeling results for nearshore tsunami propagation and onshore inundation. A fully nonlinear Boussinesq model (FUNWAVE-TVD) is used to capture the characteristics of tsunami propagation, both nearshore and inland. In addition to the inundation line as the main result of this work, other tsunami quantities such as inundation depth and maximum velocities will be discussed for the whole USEC area. Moreover, a discussion of most vulnerable areas to a possible tsunami in the USEC will be provided. For example, during the inundation simulation process, it was observed that coastal environments with barrier islands are among the hot spots to be significantly impacted by a tsunami. As a result, areas like western Long Island, NY and Atlantic City, NJ are some of the locations that will get extremely affected in case of a tsunami occurrence in the Atlantic Ocean. Finally, the differences between various tsunami sources modeled here will be presented. Although inundation lines for different sources usually follow a similar pattern, there are clear distinctions between the inundation depth and other tsunami features in different areas. Figure below shows the inundation depth for surrounding area of the Ocean City, MD. Figure (a) and (b) are the envelope inundation depth for SMF and coseismic sources. Figure (C) shows the inundation depth for CVV source, which clearly has the largest magnitude amongst the sources studied for this work.