The “Carbon Data Explorer”: Web-Based Space-Time Visualization of Modeled Carbon Fluxes
Abstract:
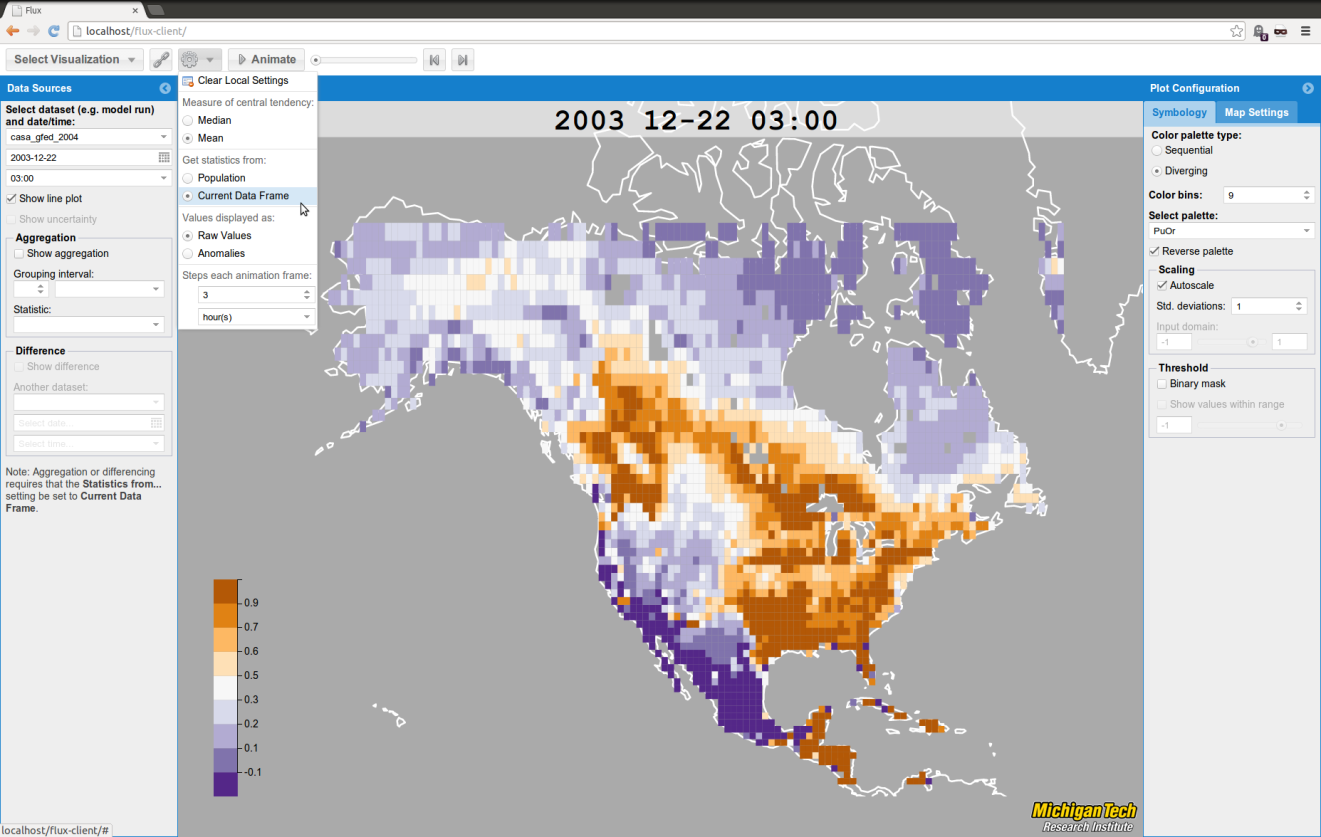
A new tool is in development that is intended to help scientists with the latter parts of that workflow. The tentatively-titled “Carbon Data Explorer” (http://spatial.mtri.org/flux-client/) enables users to access carbon science and related spatio-temporal science datasets over the web. All that is required to access multiple interactive visualizations of carbon science datasets is a compatible web browser and an internet connection. While the application targets atmospheric and climate science datasets, particularly spatio-temporal model estimates of carbon products, the software architecture takes an agnostic approach to the data to be visualized. Any atmospheric, biophysical, or geophysical quanity that varies in space and time, including one or more measures of uncertainty, can be visualized within the application.
Within the web application, users have seamless control over a flexible and consistent symbology for map-based visualizations and plots. Where time series data are represented by one or more data “frames” (e.g. a map), users can animate the data. In the “coordinated view,” users can make direct comparisons between different frames and different models or model runs, facilitating intermodal comparisons and assessments of spatio-temporal variability. Map views can display data anomalies (values relative to the measure of central tendency), aggregate data, or difference data. New features are forthcoming as the application is currently in constant development but an early version is available for the public to try out on the web (http://spatial.mtri.org/flux-client/).