A multifaceted approach to understanding dynamic urban processes: satellites, surveys, and censuses.
Abstract:
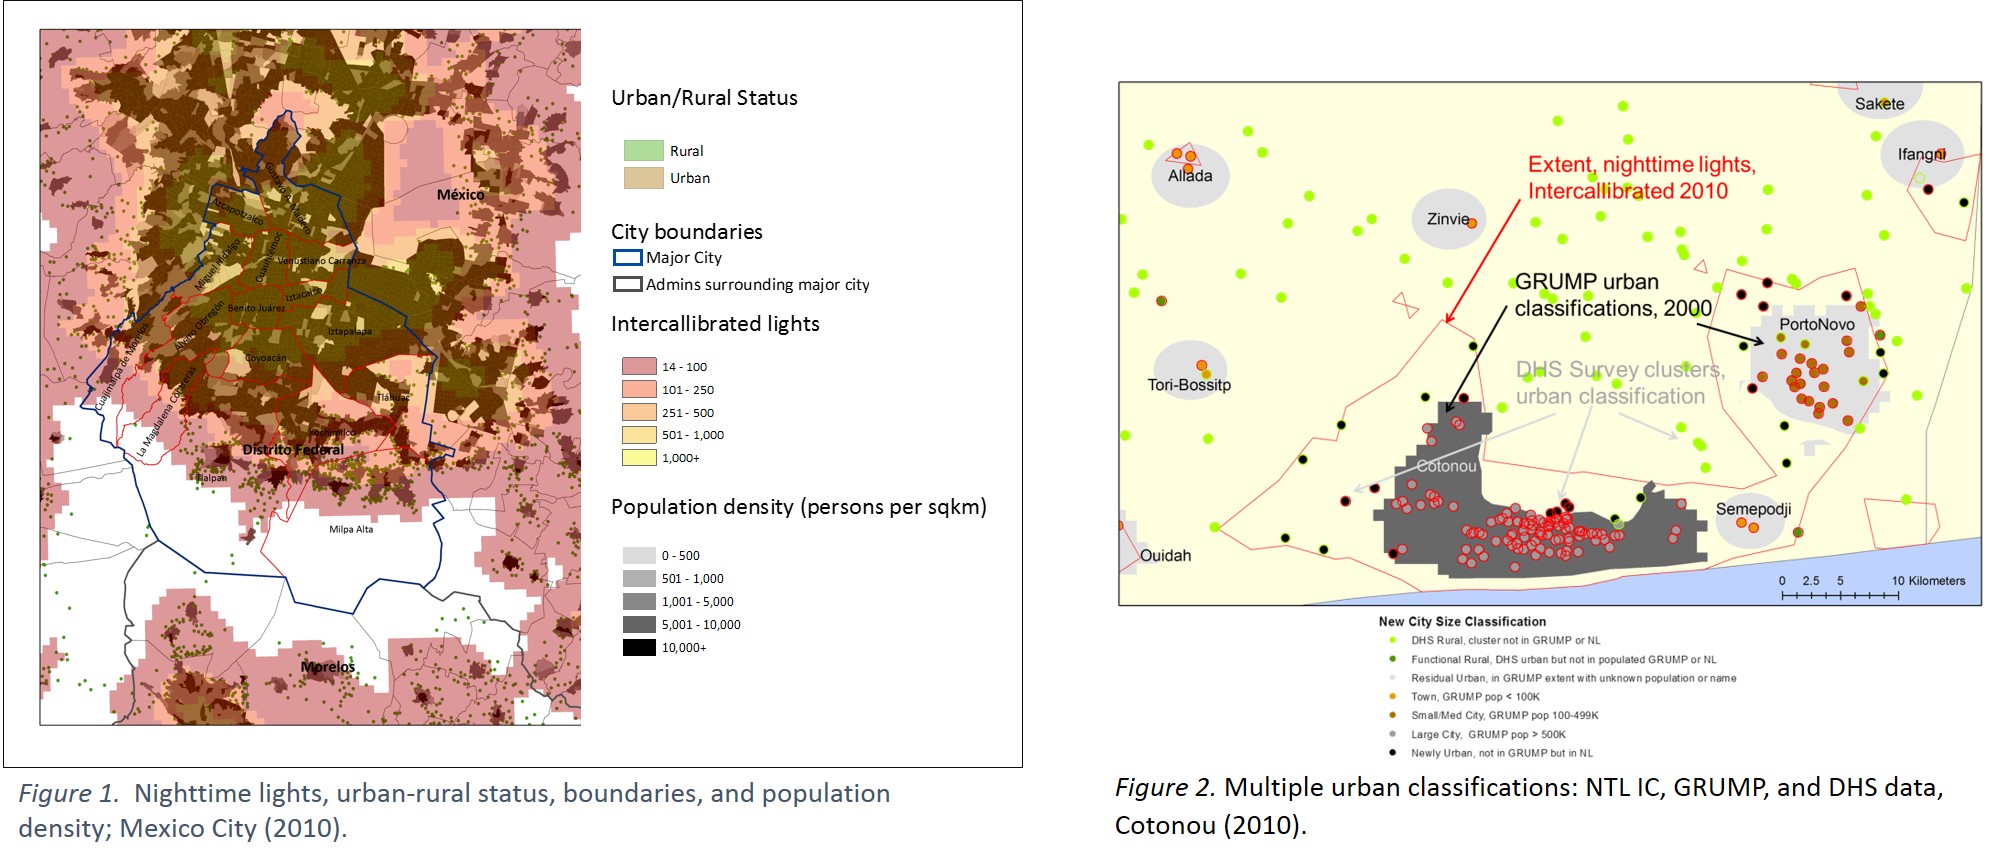
In addition to the partially modelled Global Urban-Rural Mapping Project (GRUMP) urban extents we consider four sources of remotely sensed data that can be used to estimate urban extents; the NOAA Defense Meteorological Satellite Program (DMSP) Operational Linescan System (OLS) intercallibrated nighttime lights time series data, the newer NOAA Visible Infrared Imager Radiometer Suite (VIIRS) nighttime lights data, the German Aerospace Center (DLR) radar satellite data, and Dense Sampling Method (DSM) analysis of the NASA scatterometer data. Demographic data come from national censuses and/or georeferenced survey data from the Demographic & Health Survey (DHS) program. We overlay demographic and remotely sensed data (e.g., Figs 1, 2) to address two questions; (1) how well do satellite derived measures of urban intensity correlate with demographic measures, and (2) how well are temporal changes in the data correlated. Using spatial regression techniques, we then estimate statistical relationships (controlling for influences such as elevation, coastal proximity, and economic development) between the remotely sensed and demographic data and test the ability of each to predict the other.
Satellite derived imagery help us to better understand the evolution of the built environment and urban form, while the underlying demographic data provide information regarding composition of urban population change. Combining these types of data yields important, high resolution spatial information that provides a more accurate understanding of urban processes.