Most Negative Curvature Attribute application for Regional Faults study-A review.
Abstract ID#: 33034
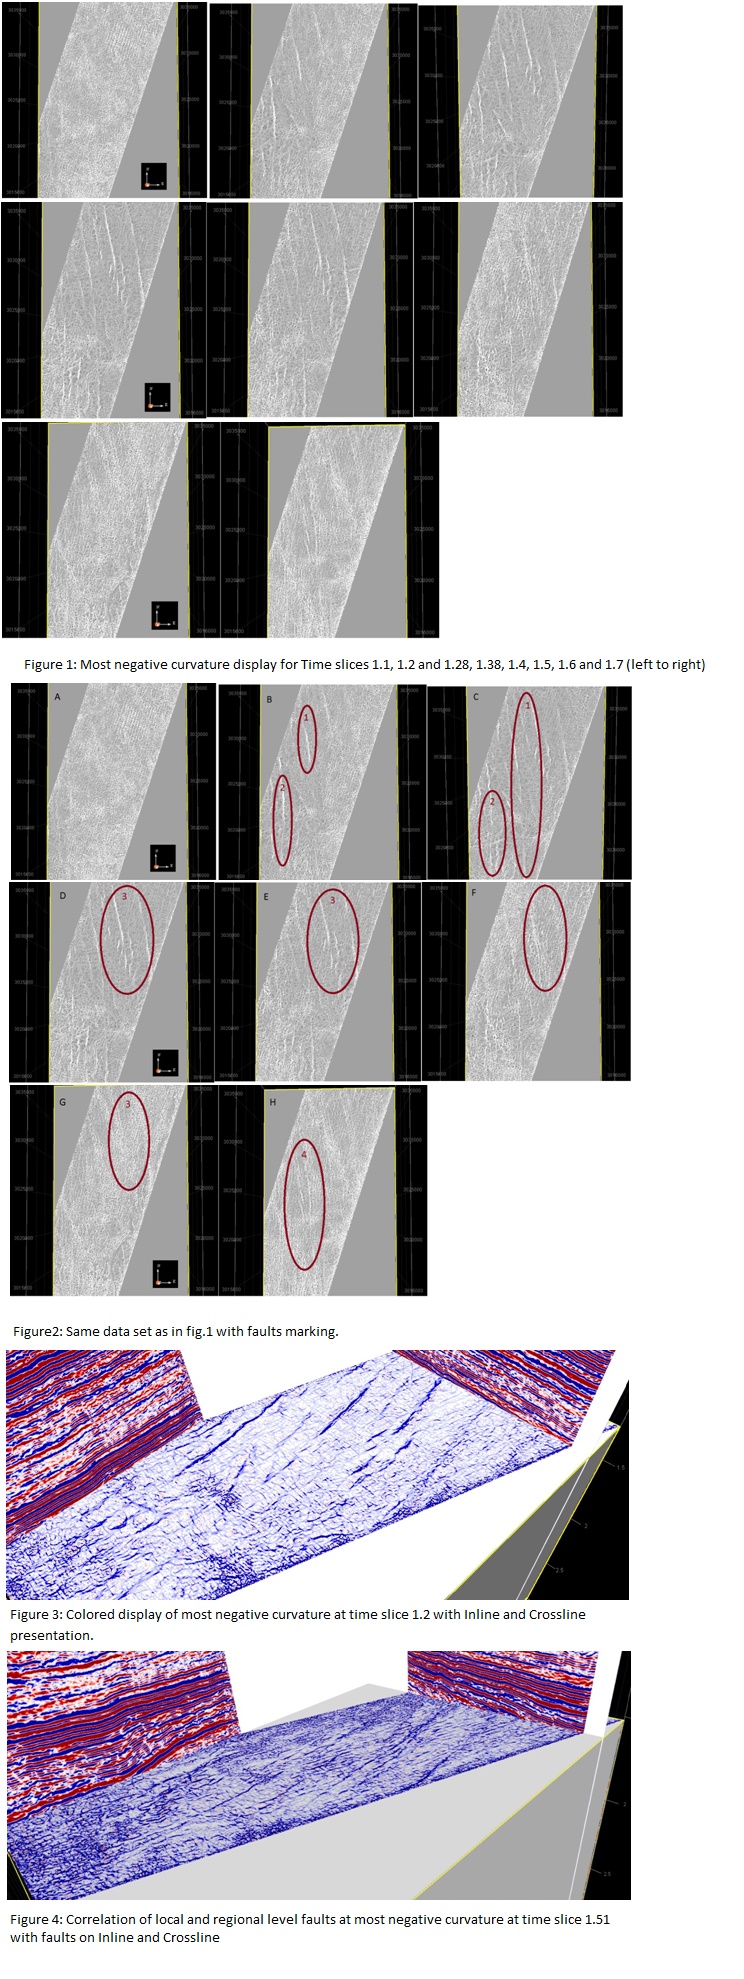
The present study relates to a fault system delineation by Time slices displays in figure1. The faults are trending northwest-southeast. At 1.1 sec the faults are not very prominent (fig.2 a) but gradually at deeper levels their presence is well defined (fig 2, b-f). In figure 2b the set of faults 1 and 2 appear which extend to south in fig 2c at time slice 1.28. To observe the faults closely the time slices are taken at a short interval. Another set fault 3 appears in north (fig 2d and 2e). This diminishes at time slice of 1.5 sec (fig 2f). Overall faults become less prominent at 1.6 sec (fig 2g) and another set 4 becomes visible at time slice 1.7 sec (fig 2h).
The color choice also helps in the visibility of structures. The selected color scheme shows the area is segmented by northwest-southeast faults. This display is very good to show overall regional trends of faults. When the color scheme is changed for a time slice display at 1.2 sec the visibility of some local level faults and fractures is enhanced (figure 3). The local and regional level faults are correlated by most negative curvature at time slice 1.51 with faults on Inline and Crossline (figure 4)