
 Google
 Yelp
 Facebook
 Twitter
 ChEnected
255685 Use of Parallel Coordinates to Monitor Absorption and Stripper Columns for Optimal CO2 Removal
Parallel Coordinates is a well-recognized visualization technique introduced by Inselberg [1] [2] in which data points are represented with unlimited number of coordinates by overlaying parallel axes. It is a scalable way to represent data as any additional dimension can be visualized by adding an extra axis without affecting the rest of the graph. In parallel coordinates each dimension is drawn as a vertical (or horizontal) line, and a point is visualized as a poly-line that intercepts each axis/coordinate at the appropriate location.
The Figure below illustrates the use of parallel coordinates to demonstrate the temperature profile along an absorption column in a carbon dioxide removal process. Each of the seven poly-lines represent a different time sample with eleven temperature measurements. The time axis is the first parallel coordinate, and the temperature parallel axes are in the same order placed in the absorber (bottom to top). The high and low values and temperature scaling are made the same for all temperature axes. The use of parallel coordinates not only assists the visualization of the temperature profiles, but also allows the user to append additional axes without altering the existing configuration.
This work exploits the use of parallel coordinates to monitor the absorber and stripper columns in a CO2 removal pilot plant. In particular, parallel coordinates are used in combination with principal components to determine optimal operating regions. This technique is called PC2 [3] and consists of the visualization of scores or latent variables and the square prediction error in parallel coordinates. The insight provided by PC2 assists the data visualization and estimates the necessary adjustments in order to improve operating conditions in the CO2 removal columns. The results demonstrate the great potential that PC2 can provide to monitor industrial processes.
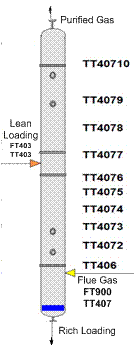
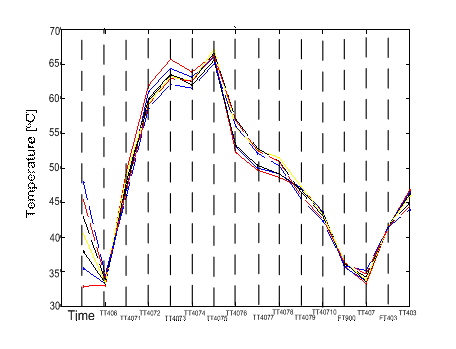
The measurements from the absorption column sensors (left) are used in the parallel coordinates plot (right) for process monitoring. Such a visualization tool can provide an important insight of the plant operations and multivariable statistical control of the process.
References
[1] A. Inselberg and B.Dimsdale, Parallel coordinates - a tool for visualizing multidimensional geometry. 1st IEEE Conf On Visualization (Visualization 90), San Francisco, CA, OCT 23-26, 1990; 361--378.
[2] A. Inselberg, Visual data mining with parallel coordinates, Computational Statistics. 1998; 13,(1) ; 47--63.
[3] R. Dunia, T. Edgar and M. Nixon, Process Monitoring using Principal Components in Parallel Coordinates. Paper accepted for Publication in AIChE Journal.
See more of this Group/Topical: Computing and Systems Technology Division