
 Google
 Yelp
 Facebook
 Twitter
 ChEnected
266600 Analytical Model of Local Distribution of Chemicals in Tissues with First Order Rate Metabolism Kinetics
Analytical model of local distribution of chemicals in tissues with first order rate metabolism kinetics.
Alexander Golberg,
Department of Mechanical Engineering, Etcheverry Hall, 6124, University of California at Berkeley, Berkeley, CA 94720 USA
Email: agolberg@gmail.com
Tel: +1 -510-2216557
Abstract
The profile of regional distribution of chemicals in tissue is important for the fundamental analyses of metabolism, morphogenetic growth control and the development of novel regional therapies. One of the challenges in tissue and whole organ research is predicting local chemical distribution. Here we introduce an analytical approach for the temporal and spatial regional distribution mapping of chemicals in metabolically active, perfused tissues. The new aspect of this model is in local chemical concentration dependence on of tissue perfusion rate, in addition to diffusion and metabolism rates. Using Duhamel theorem we performed dimensionless and dimensional analysis for local chemical distribution and report on steady-state and transient solutions for tissues with the first rate kinetic order of clearance by perfusion and metabolism. The predictions of our model are in good correlation with clinically observed data on percutanious ethanol ablation volumes of liver. Our study shows the importance to incorporate tissue perfusion rate to the fundamental understanding of in vivo intercellular signaling and treatment planning of regional therapies, which include local drug injection, which include electrochemotherapy, percutanious ethanol ablation and regional anesthesia.
Table 1. Model inputs and values investigated in the parametric study.
Variable | Physical Property | Units | Investigated range |
t | Time from the compound introduction | s | 1E-3-1E+3 |
x | Distance from the source | m | 1E-3-1E-1 |
B | Boundary concentration | M | 1 |
D | Diffusion coefficient of a chemical compound in the tissue | m2∙s-1 | 5E-6 |
wp+kb | Average tissue perfusion rate and first order metabolic rate. | s-1 | 1E-4 – 7E-2 |
ε | Minimal fraction of the chemical compound that causes to a desired effect |
| 4E-1-9.5E-1 |
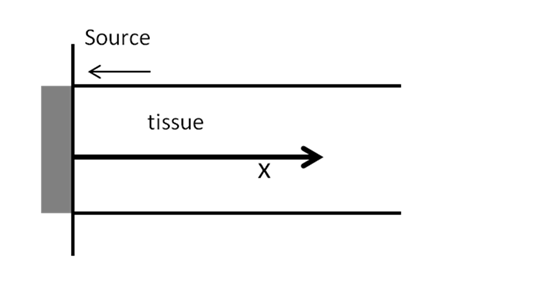
Fig.1 Analyzed physical system.
|
|
|
|
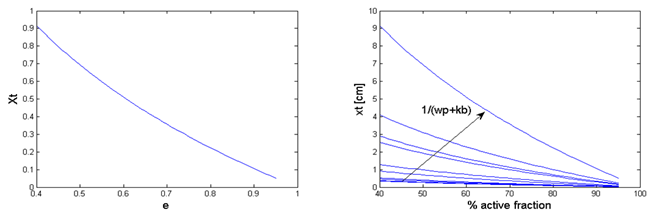
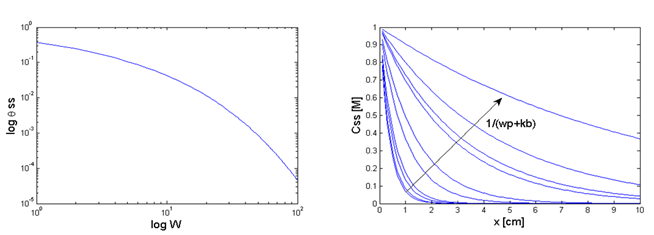
Fig.2 Parametric study results. a. Dimensionless drug penetration depth (Xt) as a function of minimum active concentration(ε). b. Drug penetration depth as a function of a drug fraction in %. c. Dimensionless steady state concentration as a function of dimensionless metabolic rate (W). d. Drug steady-state concentration (Css) for various perfusion and absorption rates.
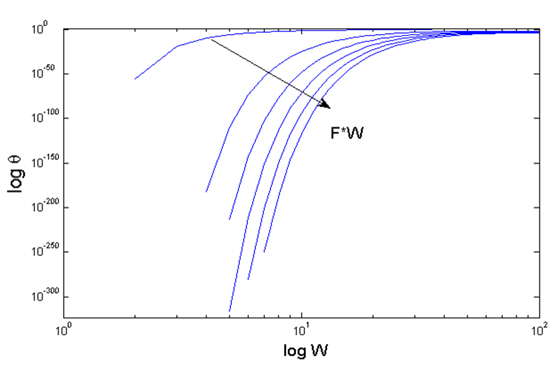
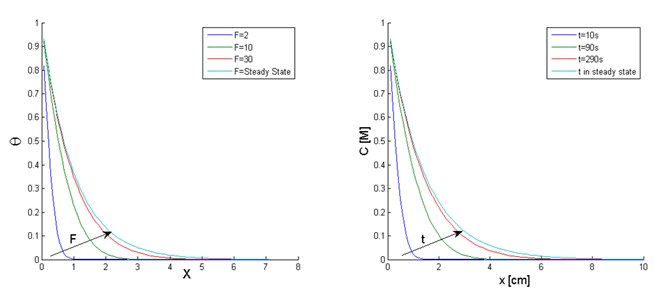
Fig.3 Parametric study results. Transient dimensionless concentration as a function of dimensionless perfusion rate (W) and time (F).
b a
Fig.4 Parametric study results. a. Transient dimensionless concentration as a function of dimensionless time and location for dimensionless perfusion rate W=50 b. Transient concentration as a function of time and location for perfusion rate wp+kb=5*10-3 s-1.
a b
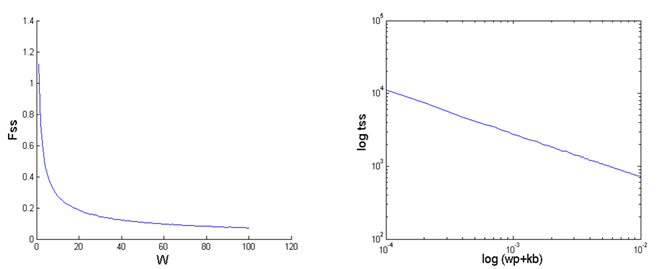
Fig.5 Parametric study
results. a. Dimensionless time to steady-state (Fss) as a
function of dimensionless metabolic rate (W) b. Time to reach steady
state (tss) as function of perfusion (wp) and metabolism
rates (kb).
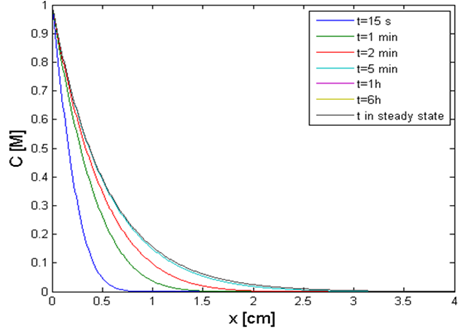
Fig.6 Practical example. Ethanol concentration in a liver as a function of location and time during percutaneous ethanol injection therapy. The system parameters appear in Table 2. 98% ethanol was injected in the liver (Boundary condition).
Table 2. Diffusion and metabolic parameters for percutaneous ethanol injection of liver model.
Variable | Physical meaning | Values |
D | Diffusivity | 2.2E-3 cm s-1 |
kb | First order kinetics of ethanol absorption in liver | 8.1E-4 s-1 |
wp | Average perfusion rate of small rat liver tumor | 45.5 ml 100gr-1min-1 |
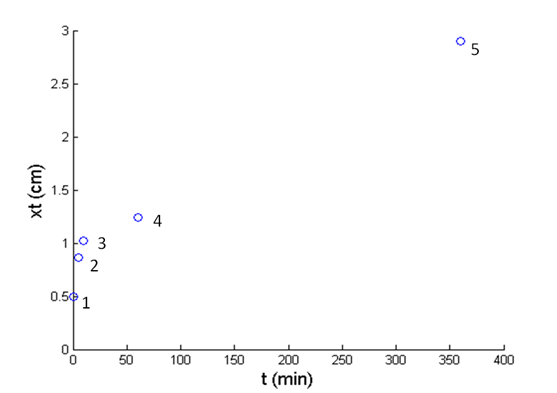
Fig.7 Practical example. Calculated distance from the injection point at which ethanol causes liver tumor ablation by necroses (points 1-4) and apoptosis (point 5) as described in Table 3:
Table 3. Toxic ethanol concentration for various exposure durations.
Time [s] | Critical concentration % | ε | Point N on Fig. 6 |
15 | 40 | 0.4 | 1 |
300 | 20 | 0.2 | 2 |
600 | 15 | 0.15 | 3 |
3600 | 10 | 0.1 | 4 |
21600 | 0.046 | 0.0046 | 5 |
See more of this Group/Topical: Topical 7: Biomedical Applications of Chemical Engineering