
 Google
 Yelp
 Facebook
 Twitter
 ChEnected
267900 Three Step Approach for Characterization of Non – Ideal Flows in Chemical Reactors
A THREE STEP APPROACH FOR CHARACTERIZATION OF NON – IDEAL FLOWS IN CHEMICAL REACTORS
Introduction
The concept of non-ideal flow in reactors is taught in the Under – Graduate (UG) curriculum at IIT Madras via theory lectures and laboratory tracer experiments. The difference in the Residence Time Distribution (RTD) profile measured in the lab, and the ideal RTD profiles for CSTRs and PFRs, is used to illustrate the effect of ‘real' or non-ideal flow in reactors, on RTD. In this work, we propose a different methodology for teaching the concepts of non-idealities in flow reactors, and residence time distributions. The focus here is on providing a more visual basis for the concepts, thus enhancing students' understanding, and comfort levels.
Methodology
First, it is proposed that a visual tracer material be used in the laboratory reactor, and snapshots of the movement of the tracer through the reactor be taken at several instants of time, at a host of nominal operating conditions. Next, the routine tracer experiment involving the measurement of outlet tracer concentrations, and evaluation of the RTD profile from the same, is to be performed. The non-idealities such as bypassing, dead volumes, re-circulating zones, etc. can be observed in the snapshots, whereas the impact of these on RTD profiles can be directly analyzed via the second experiment.
Next, it is proposed that Computational Fluid Dynamics (CFD) simulations of the same reactor be performed by the students. The steady-state CFD simulations will provide rich information regarding velocity contours all over the reactor while the unsteady simulations give the species contour information at various instants of time. This can be linked to the visual tracer snapshots, for validation, and also, for further understanding. A ‘numerical' tracer experiment may then be performed in CFD, using established procedures, to obtain a CFD-predicted RTD profile. This is easily validated against the experiments above.
Analysis
With these four pieces of information, it will be very easy to illustrate concepts to the students. In the past year, we have used this methodology and analyzed a stirred flow reactor of dimensions 21 cm height and 16cm in diameter that is in the Chemical Engineering Lab here. The specific operating conditions, at which bypassing and dead zones (among other non-idealities) are clearly visible, were identified. This was used to illustrate the connection between RTD and non-idealities, very successfully.
In the third year UG class on Chemical Reaction Engineering, the method was demonstrated to the group of 70 students in April 2012. Their performance on tests was found to improve, and their understanding of the concepts deepened after the visual tracer and CFD results were shown to them. In the future, we expect that such CFD simulations should become a routine part of the UG curriculum, due to its increased importance as a design tool. We believe that this simple methodology therefore has the potential to significantly alter student's perspective on reactor modeling, in the future years.
Preliminary results
The dimensions of the cylindrical Continuously Stirred Tank Reactor (CSTR) are: Length (L) = 17cm & Diameter (D) = 16cm. The impeller is at a distance of 5cm from the bottom of the reactor. The dimensions of the impeller blade are: width = 0.2cm, height = 0.5cm & depth = 2.4cm. The radius of the inlet is 2.5cm and is present at a distance of 4cm from the bottom of the tank. The geometry is shown in figure 1.
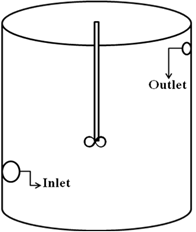
Figure 1: Schematic of the laboratory CSTR
Experimental and CFD studies were carried out on the reactor. To illustrate a case of bypassing, the study in which stationary impeller results in bypassing has been shown here. Figure 1 shows the snapshots taken from the visual tracer experiment at various intervals of time. Figure 2 gives the snapshots of the tracer along a plane containing the inlet and the outlet, at similar instants of time. These snapshots seem to match the visual tracer ones in Figure 1. The virtual RTD carried out using CFD results in a sharp peak initially signifying bypassing.
Each of these tools helps in analyzing the system better. The visual tracer experiments help us in determining the non- ideality visually without being able to quantify it. The CFD results help in quantifying the non-ideality and determining its exact location in the reactor. CFD is used for optimum designing of chemical reactors. The experimental RTD when compared with the ideal one gives an idea of the deviation from the ideality.
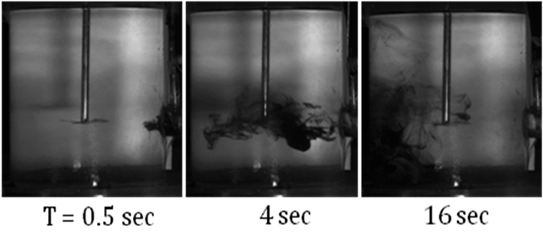
Figure 2: Bypassing seen in visual tracer experiment
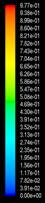
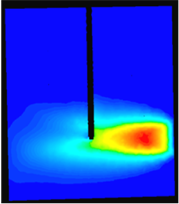
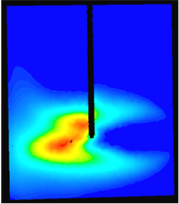
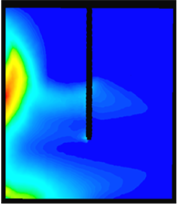
Figure 3: Bypassing seen in CFD simulations
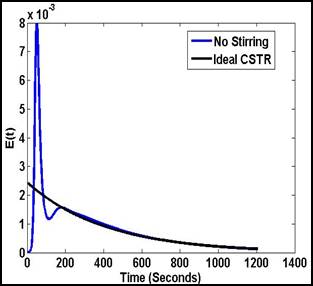
Figure 4: RTD of the reactor showing bypassing
Keywords: Residence Time Distribution, Computational Fluid Dynamics, Bypass, Dead zone, Re-circulation.
See more of this Group/Topical: Education Division