
 Google
 Yelp
 Facebook
 Twitter
 ChEnected
271872 Ultrasound Measurements of Temperature Profile Across Gasifier Refractories
Ultrasound Measurements of Temperature Profile Across Gasifier Refractories
Yunlu Jia and Mikhail Skliar
Department of Chemical Engineering
University of Utah
Coal and biomass gasification is a process characterized by extreme operating conditions of high temperatures and pressures, chemical aggressiveness, and mechanical abrasion. Several technological challenges impact the reliability and economics of coal gasification. The key challenge remains the complete lack of sensors that are capable to reliably perform in harsh environment over an extended period of operation. The conventional approach of developing hardened conventional insertion sensors has proven to have limited effectiveness in the aggressive gasifier environment. Gasifier operators routinely use “indirect measurements”, such as methane concentration in the gasifier product gas (“temperature” is reported in ppm of methane!), to estimate the average temperature in the system. Such indirect methods cannot be used to infer temperature if the observed methane concentration is caused by the presence of a region or regions inside the gasifier that are running particularly hot. Note that optical techniques, including combustion specific measurements of temperatures and reaction composition, are hardly suitable for a pressurized, slagging gasifier since the flowing slag blocks optical access ports. They are also not suitable for measuring thickness and other characteristics of non-reflective and non-transparent containments.
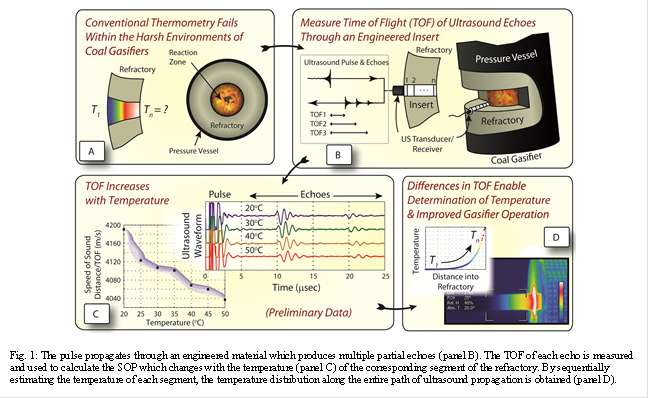
In this presentation, we describe a novel approach that uses noninvasive ultrasound to measure: (1) spatial distribution of temperature across the refractory or other containment; (2) temperature of the hot side of the refractory and (3) refractory thickness. In the simplest implementation of the temperature measurements using ultrasound (US), the time of flight (TOF or return delay) of an US pulse introduced on the cold side of the refractory and reflected from the refractory's hot side is measured. The temperature dependence of the speed of sound can then be used to determine an “average” temperature over the refractory thickness. This simple approach fails when significant thermal gradients are present, as is the case for gasifier refractories. The central idea, summarized in Fig. 1, which enables us to measure the temperature distribution when large gradients are present, is to create an US propagation path inside the refractory with controlled backscattering at predetermined spatial locations. In Fig. 1, the same piezoelectric element serves as the transducer and receiver; modification for the case of a separate receiver is straight forward. The transducer-generated pulse propagates through an engineered material which produces multiple partial echoes (panel B). The time of flight of each echo is measured and used to calculate the speed of sound (SOS) which changes with the temperature (panel C) of the corresponding segment of the refractory. By sequentially estimating the temperature of each segment, the temperature distribution along the entire path of ultrasound propagation is obtained (panel D). We will present experimental validation of this approach and outline options for creating engineered materials that produce partial US reflections from pre-determined positions. The achievable accuracy and spatial resolution of the measured temperature profile will be discussed.
See more of this Group/Topical: Topical D: Accelerating Fossil Energy Technology Development Through Integrated Computation and Experimentation