
 Google
 Yelp
 Facebook
 Twitter
 ChEnected
277994 Bubble Growth and Expulsions in Natural Circulation Boiling Loop
Bubble Growth and Expulsions in Natural Circulation Boiling Loop
Aranab Karmakar and Swapan Paruya
Chemical Engineering Dept., NIT Durgapur, India – 713209
Introduction
Natural circulation boiling loop (NCBL) containing steam-water mixture has extensive applications in boiling water reactors (BWRs) and all the thermosyphon reboiler units of chemical, refining and petrochemical plants, etc. due to its excellent heat removal properties without the application of pump. During startup operation, NCBL experiences various nonlinear flow instabilities1. One of the major instabilities is geysering phenomenon induced by wall-superheating at boiling incipience. The mechanism and dynamic characteristics of the geysering have been studied by many investigators2-7. However, a cycle of geyseing is completed in three consecutive stages - (1) refilling through condensation of vapor to stop boiling, (2) incubation to initiate bubble formation, and (3) expulsion of liquid and vapor as a result of self-evaporation induced by decrease in static head. The expulsion is usually recognized by surge of loop flow rate in NCBL.
Efforts have been made in the recent past to identify geysering to be periodic or chaotic. As described above, the phenomenon is highly complex. It is therefore always challenging to investigate the same. Here we present an experiment based on picture motion browser (PMB) with the help of Sony Handy Cam (HRD-XR160, 24 frames/sec, 3.3 mega pixels) to visualize the bubble growth and the associated expulsion phenomenon in geysering.
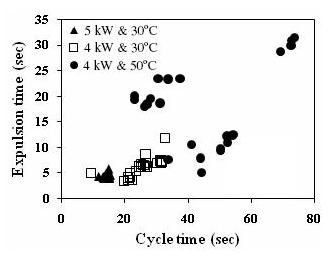
The present experimental study reports bubble growth, expulsion time and expulsion period (cycle time) under the varied conditions of heater power and inlet subcooling in a natural circulation boiling loop. The analysis of high-speed video reveals that expulsions coupled with the bubble growth phenomenon and the associated flow oscillations are highly complex depending on inlet subcooling and heater power.
Bubble Growth and Flow Pattern Transition
Our NCBL mainly consists of six parts ― heated section, adiabatic riser, condenser, down-comer, upper and lower plenum. The rectangular loop was fabricated of SS 316. RTDs, pressure sensors and DPT, and electromagnetic flow meter (EFM) have been employed to measure temperature, local pressure, differential pressure and loop flow rate respectively.. An accurate control of heater power has been made by a thyristor power controller in PID mode. All signals from sensors come to SCADA panel. The data-logger software (DAQ) in the computer records the data from all sensors via SCADA panel @ 0.5 Hz.
At the lower heater power Q and high inlet subcooling DTsub (=Tsat-Tin), expulsions occur at irregular and low frequency. During rapid expulsion, both bubbles and liquid flow upward with very high velocity. However, the vapor-jet pulls the liquid up in the channel during the expulsions. The developing bubbly flow is shown in Figure 1(a). Just after 0.2 sec the developing spherical bubbles coalesce to form the developed bubbly flow, which is shown by Figures 1 (b-c). With the initiation of fully developed bubbly flow, the violent vapor expulsion starts, and the flow regime quickly changes to the slug one as a consequence of the coalescence of the developed spherical bubbles shown in Figures 1 (d-e). During violent expulsion of vapor and liquid, big slug-bubbles form due to the coalescence of small ones and then get condensed to small ones in the riser section (refer Figures 1 (f-p)). After some time, the expulsions stop. At the time instants of 1.28, 2.40, 2.60 and 3.0 sec, the slug-bubbles are observed to be big and glazy ones. In the intermediate time, the less glazy and smaller slug bubbles form. At 2.64 sec and 3.04 sec, the bubble collapse due to condensation is observed.
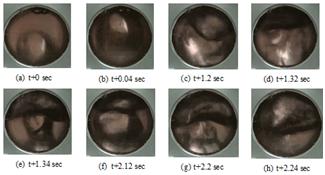
At higher DTsub and lower Q vapor-mushrooms are observed to form. The vapor-mushrooms are trailed by vapor stems at their bottom. In the subcooled boiling flow, the vapor-mushrooms and vapor stems are also reported in the literature8-9. Figures 2(a-h) display flow-patterns transition captured at Q=4 kW and DTsub = 30 oC. Figures 2(a-d) show the gradual growth of the developed (large) slugs from small slugs or bubbles. If the heater power is lower, the big slug bubbles do not form frequently. The smaller slug bubbles form just after the rapid expulsion of the larger slug bubbles. The smaller ones coalesce with the larger ones to form a mushroom-like shape shown in figure 2(e). Figures 2(f-h) show the different size and shape of the vapor-mushrooms at different time of the expulsion. The different size distribution of bubbles in turn produces shear stress fluctuation in the vapor-liquid interface and creates the distortion of the interface. As a result, the vapor-liquid interface becomes more complex in case of lower heater power.
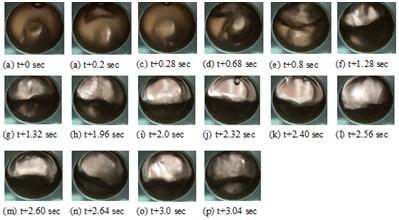
Figure 3.
Expulsion time vs. cycle time at different Q and DTsub Flow expulsion Interestingly, the expulsions have
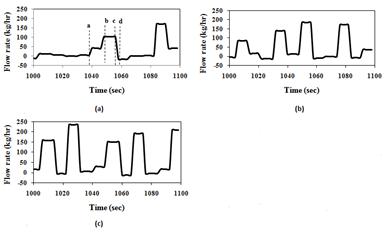
been indicated by high loop flow rate Wloop. The time series of Wloop
at different Q and DTsub
are shown in Figure 4. The peak flow rates are the signature of the expulsions
at different time intervals. In Figure 4(a), the expulsion stage and the
refilling stage are indicated by vertical dotted line a, b, c and d. In the
region ab, developing bubbly flow observed, where loop flow rates start to
increase. The region bc corresponds to the violent jet-flow in the heater section
(expulsion), where the maximum flow rates were observed. In the region cd, the
loop flow rates decrease suddenly due to the collapse of bubbles in the riser
of NCBL. The cold liquid the riser enters the heater section just after violent
expulsion. Reverse flow or flow termination occurs and non boiling condition
exists in the heated section. After the region cd incubation starts, where
initial stage of nucleate boiling observed in the heated channel. This stage is
noticed by the flat line in the time series just after the region cd. At the
low DTsub
and high Q, the frequency of flow oscillations increases and becomes more
regular as evident in Figures 4(b-c).
Figure 4. Time
series of loop flow rate, 4 (a) at Q=4 kW and DTsub=50 oC, 4 (b) at Q=4 kW
and DTsub=30
oC, 4 (c) at Q=5 kW and DTsub=30 oC. Conclusions
Acknowledgement
The authors also
thankfully acknowledge the financial support of Department of Science and
Technology, New Delhi, India under SERC scheme (Sanction #
SR/S3/CE/089/2009). References
circulation loop. In: Proceedings of the 13th National Heat Transfer Conference
of AIChE Sym.1973:69;37-45.
for geysering in a natural circulation loop using an impedance needle probe.
Ind. Eng. Chem. Res. 2009;48:2020-2033.
See more of this Group/Topical: Engineering Sciences and Fundamentals