
New Vapor Compression Alternatives in Thermally Coupled Distillation
José A. Caballero*; Miguel A. Navarro; Juan .A. Reyes-Labarta
*Department of Chemical Engineering. University of Alicante. Ap. Correos 99. 03080 Alicante. Spain
Abstract
The costs of chemical process are often dominated by the separation costs. Between the different separation techniques, distillation is the most important and commonly used in all chemical and petrochemical industries. Distillation handles more than 90% of separations and and this trend seems unlikely to change in the near future. The capital investment for these distillation systems was estimated in 8x10⁹ US$ [1]. Soave & Feliu [2] calculated that distillation accounts about the 3% of the total US energy consumption which is equivalent to 2.87x10¹⁸ J or 54 million tons of crude oil.
A renew interest in Thermally Coupled Distillation (TCD) appeared in, say the last 15-20 years, due the important potential savings in energy: typical values around 10% to 50 has been reported [3-5] when compared with conventional distillation sequences. Although it has been proved that fully thermally coupled systems are the arrangements that requires the minimum energy in a sequence of columns [6] it is possible to identify situations in which some column sections are operating far away the optimal conditions. For the sake of simplicity, but without losing generality, we will focus on the special case of a three component Petlyuk configuration or its thermodynamically equivalent Divided Wall Column (DWC). It will be evident that the extension to other thermally coupled configurations with more complex arrangements is straightforward.
The simulation of a DWC or its thermodynamically equivalent Petlyuk configuration can be carried out by decomposing it in the three separation tasks that form the sequence (See Figure 1) - each one of these separation tasks can be considered a distillation column- If we optimize each one of these columns independently, when we put together columns 2 and 3 (referred to Figure 1) it is evident that we have to modify the liquid or vapor flows in column 2 or column 3 to satisfy the mass balance -See Figure 1b-. (Usually it is better to perform a simultaneous optimization of all the system –included column 1- to get the optimal performance of the configuration). But the adjustment of flows produces that some sections work in suboptimal conditions (at least when compared to the individual separations tasks). If the dominant column is column 3 we have to increase flows in column 2 and then condenser duty increases. If the dominant column is column 2 the flow adjustment in column 3 produces an increase in the reboiler duty.
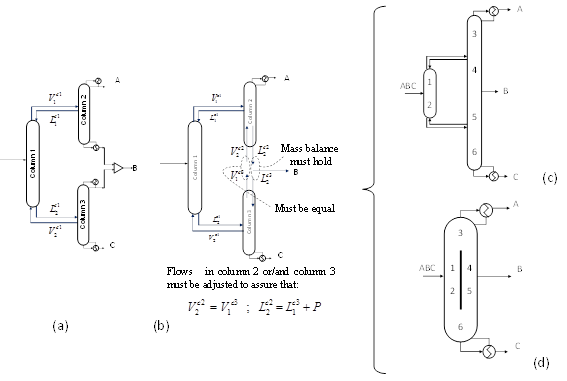
Figure 1. Generation by decomposition in its basic separation tasks of a Petlyuk configuration (c) and the equivalent Divided Wall Column (d).
Instead of adjusting the flows, it is possible to introduce a heat exchanger (reboiler or condenser), but the extra heat added/removed is approximately equal to the extra heat if the flows are adjusted, and it is necessary to include an extra heat exchanger. Alternatively, it is possible to withdraw the extra vapor/liquid flow and use this stream as utility in the rest of the plant, what not always is feasible. An interesting alternative, presented in this paper, consists of implementing a vapor compression cycle using this extra vapor/liquid stream as shown in Figure 2.
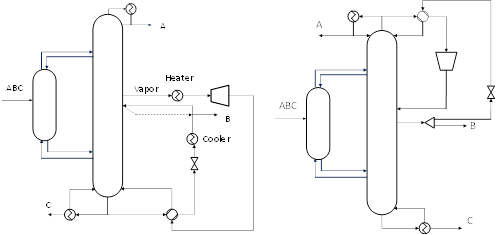
Figure 2. Vapor compression and integration with the column reboiler (left) or condenser (right).
Some of the characteristics of these new arrangements are the following:
1. In Petlyuk/DWCs is usually not economically attractive to implement a vapor compression cycle between condenser and reboiler due to the large difference of temperatures (there is at least one component with an intermediate boiling point) and therefore large compression ratios. But with this arrangement the difference of temperatures is smaller and then the alternative could be economically attractive.
2. Both the heat duties in reboiler and condenser are reduced: the first one is due to the heat integration in the vapor compression; the other due to the reduction of internal vapor and liquid flows in the corresponding section.
3. There is a tradeoff between the savings in energy consumption in reboilers and condensers and, the investment and operation of the new equipment, mainly the compressor.
Examples
We present here two examples. Corresponding to each one of the options presented in Figure 2. The first one consists in the separation of a mixture of Benzene, Phenol and o-Cresol (Data and main results are showed in Tables 1 and 2). All simulations were carried out in Aspen-Hysys using SRK equation of state and default values. Cost correlations are from Turton et al [7], and updated to 2012 cost. In this example it is necessary increase the boilup ratio (column 3 in Figure 1) to avoid a very large number of stages in the column, which produces large energy consumptions in the reboiler (this is an intrinsic problem of this system independently of the column sequence).
It is interesting remark that the savings in energy in the reboiler are greater than 80%. There is also a similar reduction in the energy consumption in the condenser. The investment is amortized during the first year of operation. After the amortization the savings in utilities cost is around 2.9 MM€/year (~ 76% in reduction in cost of utilities).
Table 1. Data and main results for the example 1 without compression cycle.
DWC/Petlyuk | Feed | Product A | Product B | Product C | |
Flow (kmol/h) | 200 | 60.00 | 60.04 | 79.96 | |
Composition (mol frac.) |
|
|
|
| |
Benzene Phenol o-Cresol | 0.3 0.3 0.4 | 1.000 0.000 0.000 | 0.000 0.995 0.005 | 0.000 0.001 0.999 | |
Pressure (atm) | 1 | 1 | 1 | 1 | |
|
|
|
|
| |
Condenser Duty (kW) | 13096 |
|
|
| |
Reboiler Duty (kW) | 13607 |
|
|
| |
Utilities annual cost (k€/year) | 3846.153 |
|
| ||
Table 2. . Data and main results for the example 1 with compression cycle.
DWC/Petlyuk + Compression Cycle | Feed | Product A | Product B | Product C |
Flow (kmol/h) | 200 | 60.03 | 60.00 | 79.97 |
Composition (mol frac.) |
|
|
|
|
Benzene Phenol o-Cresol | 0.3 0.3 0.4 | 1.000 0.000 0.000 | 0.0005 0.9925 0.007 | 0.000 0.0003 0.9997 |
Pressure (atm) | 1 | 1 | 1 | 1 |
|
|
|
|
|
Condenser Duty (kW) | 1741 |
|
|
|
Reboiler Duty (kW) | 2686 |
| ||
Extra Reboiler Heat exchanged (kW) Cost (k€)
| 10921 540.40
| Compressor Power (kW) Pout (atm) Investment Cost (k€) Electricity Cost (k€/year)
| 836.2 2.0 658.88 305.85
| |
Heater Heat exchanged (kW) Investment Cost (k€) Steam Cost (k€/year)
| 215.9 15.998 48.296
| Cooler Heat exchanged (kW) Investment Cost (k€) Water Cost (k€/year)
| 1382 78.672 14.066
| |
Total Investment Cost (k€)* | 2149.437 |
| ||
Utilities Annual Cost (k€/year) | 908.609 |
| ||
*Referred to new equipment.
The second example corresponds to a mixture of ethylene, ethane and propane. Here the main cost is due to the necessity of refrigeration in the condenser, and therefore the implementation of a reverse cycle (expansion previous compression) is of interest (second case in Figure 2). Tables 3 and 4 shows main data and results
In this example the energy savings in condenser is around 39%. The investment is amortized in less than two years. After this time the benefit is around 2.8 MM€/year.
Table 3. Data and main results for the example 2 without compression cycle.
DWC/Petlyuk | Feed | Product A | Product B | Product C | |
Flow (kmol/h) | 2000 | 600 | 600 | 800 | |
Composition (mol frac.) |
|
|
|
| |
Ethylene Ethane Propane | 0.3 0.3 0.4 | 0.9996 0.0004 0.000 | 0.0065 0.9920 0.0016 | 0.0000 0.0002 0.9998 | |
Pressure (atm) | 20 | 20 | 20 | 20 | |
|
|
|
|
| |
Condenser Duty (kW) | 13902 |
|
|
| |
Reboiler Duty (kW) | 16475 |
|
|
| |
Utilities annual cost (k€/year) | 8939.917 |
|
| ||
Table 4. . Data and main results for the example 2 with compression cycle.
DWC/Petlyuk + Compression Cycle | Feed | Product A | Product B | Product C |
Flow (kmol/h) | 2000 | 600 | 600 | 800 |
Composition (mol frac.) |
|
|
|
|
Benzene Phenol o-Cresol | 0.3 0.3 0.4 | 0.9997 0.0003 0.0000 | 0.0013 0.9939 0.0048 | 0.0000 0.0004 0.9996 |
Pressure (atm) | 20 | 20 | 20 | 20 |
|
|
|
|
|
Condenser Duty (kW) | 9410 |
|
|
|
Reboiler Duty (kW) | 10415 |
| ||
Extra Condenser Heat exchanged (kW) Cost (k€)
| 5483 1906.393
| Compressor Power (kW) Pin (atm) Investment Cost (k€) Electricity Cost (k€/year)
| 1533 6.67 1207.516 560.710
| |
Total Investment Cost (k€)* | 3113.909 |
| ||
Utilities Annual Cost (k€/year) | 6078.407 |
| ||
Acknowledgements
The authors wish to acknowledge support from the Spanish Ministry of Science and Innovation under project (CTQ2009-14420-C02).
References
See more of this Group/Topical: Process Development Division