
 Google
 Yelp
 Facebook
 Twitter
 ChEnected
304948 Using Complimentary Imaging Techniques: X-Ray and MRI Studies of a Bubbling Gas-Solid Fluidized Bed
Introduction
Gas-solid fluidized systems are difficult to measure non-invasively, due to their optical opacity. Advances in instrumentation and computing power have lead to the rise of tomographic techniques, such as Magnetic Resonance Imaging (MRI) (Holland et al., 2008), Electrical Capacitance Tomography (ECT) (Du et al., 2005) and X-ray Computed Tomography (XCT) (Mudde, 2010), for observing fluidization phenomena in 3D systems. An ideal measurement technique would allow multiscale, non-invasive imaging to a high spatial and temporal resolution, and be suitable for on-line use in industrial applications. Since no single technique has all of these capabilities, it is necessary to use complimentary techniques. In order to use multiple measurement methods, the two techniques must first be cross-validated. The complimentary characteristics of the techniques can be used to gain more information about the system than would have been possible if each technique was used in isolation. This study aims to cross-validate MRI and high-speed X-ray imaging and investigate the use of these complimentary techniques for measurements in a bubbling gas-solid fluidised bed.
Experimental
Fluidization Set-Up: The bed was 50 mm I.D., provided with either a) a single orifice (orifice diameter, do, of 2 mm) or b) a 10-hole or 14-hole multi-hole (orifice diameter, do, of 1 mm) distributor. The distributors were designed to ensure that there were no jet-wall interactions. The particles were poppy seeds (0.5 mm diameter, 200 mm unfluidised bed height) fluidised with air at a superficial gas velocity of 60 - 300 mm/s, as measured at 293 K and 1 bar. The particles were classified as Group B using the Geldart particle groupings (Geldart, 1973).
MR Imaging: Experiments were conducted in a 7.1 T (300 MHz 1H frequency) magnet equipped with a Bruker AV3 spectrometer. The actively shielded gradient system was capable of producing a maximum gradient strength of 77.7 G/cm. A birdcage radiofrequency (r.f.) coil (66 mm i.d.) was used to excite and detect the 1H nuclei within the poppy seeds. The region above the distributor was imaged using 3D time-averaged and 2D ultra-fast imaging sequences.
X-ray Imaging: Experiments were conducted using the high power pulsed X-ray facility at University College London (capable of producing X-rays at 150kV and 450mA, with a pulse length of 0.2ms, and a frame capture rate of 72 fps). For this work, X-rays were generated with 38 kV for the single jet system and 41kV for the multiorifice system, and a current of 400 mA. The X-ray pulses were 500 µs long and images were acquired at 72 frames per second.
Results and Discussion
The two techniques (fast X-ray imaging and MRI) were cross-validated by measuring the length of a single jet formed at a 2mm orifice. Figure 1 shows the length of a single jet with increasing superficial gas velocity for X-ray and MRI measurements. Good agreement was seen between the jet lengths measured using the two techniques.
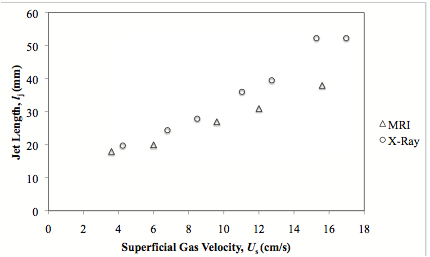
Figure 1 Jet length as a function of superficial gas velocity for a single jet from a 2 mm orifice in a bed of Group B particles.
Figure 2 shows consecutive images of the bubbling bed fitted with the 10-hole distributor acquired using X-ray and MRI. The bed was fluidised at a superficial gas flow rate of 0.21m/s. X-ray imaging is advantageous as it can image larger regions and therefore it is possible to image the gas entering as jets and the subsequent formation, coalescence and rising of bubbles in the bed. MRI cannot image as large a region, but it does allow slices of the bed to be imaged non-invasively, thereby providing more detailed information on the gas jets formed at the distributor and the bubble formation at the top of the jets. It is not possible to observe bubbles detaching from the tips of the jets in the X-ray images as the images are a projection through the bed and due to the small size of the bubbles formed, the contrast in the images is low in this region. By combining measurements from both X-ray and MRI measurements it is possible to resolve fluidization phenomena in both the grid region and higher in the bed.
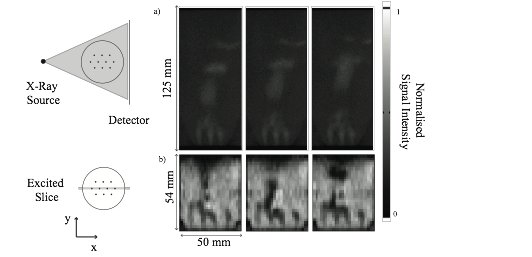
Figure 2 Fast imaging of a bubbling bed fitted with a 10-hole distributor (superficial gas flow rate, Us, of 0.21 m/s) using a) X-ray and b) MRI imaging. The separation time between frames was 13.8 and 25 ms respectively for the X-ray and MR images. The X-ray images are of the bed projected along the y-direction. The MR images are of the centre slice of the bed. The MR images show clearly the individual jets and bubble formations from the tips of the jets, which cannot be seen from the projected X-ray images. The gray-scale is inverted between the two sets of images as the particles absorb X-rays, but give an MR signal. Therefore dark regions in the X-ray images and white regions in the MR images indicate a high particle density.
A time series of projected X-ray data is shown in Figure 3. Images were projected along the y-direction to more clearly identify the trajectory of bubbles. High signal intensity indicates the presence of a high voidage region i.e. a bubble or a jet. Bubble rise velocities, bubble frequencies and bubble coalescence (labelled in Figure 3 as a, b and c respectively) can be observed.
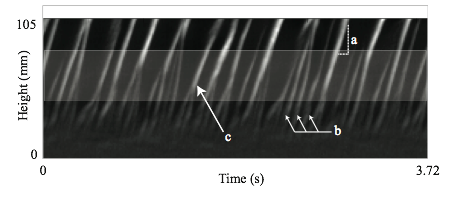
Figure 3: Time series of X-ray data projected along the x-direction for a bed fitted with a 10-hole distributor and fluidized at a superficial gas flowrate of 0.21 m/s. Several features of a bubbling bed can be extracted: a) bubble rise velocity can be calculated using the gradient of the trajectory of the bubble, b) bubble frequencies can be calculated using Fourier Transform analysis and c) bubble coalescence events can be observed. White regions indicate trajectories of bubbles passing through the bed.
Bubble frequencies can be calculated from X-ray data using a Fourier transform analysis of the projected time series. Figure 4 shows bubble frequencies as a function of height above the distributor for a 10-hole distributor with a superficial gas flow rate of 0.21 m/s. A bubble frequency of 9.2 Hz occurred at approximately 50 mm above the distributor with a smaller secondary peak at 11.8 Hz. The bubble frequency dropped to 3.5 Hz at 75 mm above the distributor with a smaller secondary peak at 7.0 Hz, indicating that either bubble coalescence or dispersion occurred in the region between 50 and 75 mm above the distributor, both of which can be observed visually in the shaded region in Figure 3. Below a height of 50 mm above the distributor, it is not possible to distinguish bubble frequencies due to the poor contrast of small bubbles in the X-ray images. However, a similar analysis can be conducted on the MR images to calculate bubble frequencies at lower heights and thereby obtain a full description of bubble frequencies in the bed using both techniques in conjunction. This paper will consider quantitative methods for calculating bubble rise velocities, bubble frequencies, bubble coalescence rates and permanent jet heights from MRI and X-ray data. The X-ray analysis will also be extended in a scale-up study of a 140 mm diameter bed.
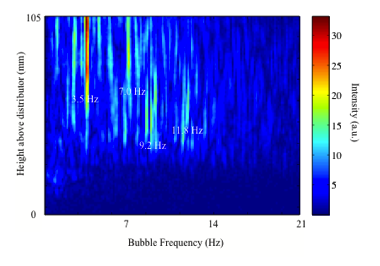
Figure 4 Bubble frequency as a function of height above the distributor for a bed fitted with a 10-hole distributor and fluidised with a superficial gas flow rate of 0.21 m/s. Peaks are seen at 9.2 Hz at 50 mm (with a secondary peak at 11.8 Hz) and at 3.5 Hz a at 75 mm and higher (with a secondary peak at 7.0 Hz). Due to the poor contrast of small bubbles in X-ray images, it is not possible to resolve bubble frequencies at heights below 50 mm using X-ray data.
Conclusions
This paper demonstrates the use of two complimentary imaging techniques in measurements of fluidized beds. MRI provides high spatial and temporal resolution data, but is limited in the height of the bed that can be measured. Conversely, fast X-ray imaging can image larger beds to a high-temporal resolution, but is limited in spatial resolution near the distributor. The two techniques can therefore be combined to observe a wider range of length scales than could be observed when using both techniques in isolation.
Acknowledgements
This work is funded by the EPSRC, Grant EP/F041772/1.
References
Du, B., Warsito, W., Fan, L.-S., 2005. ECT Studies of Gas-Solid Fluidized Beds of Different Diameters. Ind. Eng. Chem. Res. 44, 5020–5030.
Geldart, D., 1973. Types of gas fluidization. Powder Technol. 7, 285–292.
Holland, D., MŸller, C., Sederman, A., Mantle, M., Gladden, L., Davidson, J., 2008. Magnetic resonance imaging of fluidized beds: Recent advances. Theor. Found. Chem. Eng. 42, 469–478.
Mudde, R.F., 2010. Time-resolved X-ray tomography of a fluidized bed. Powder Technol. 199, 55–59.
See more of this Group/Topical: Particle Technology Forum