309453 Adapting Data Processing to Compare Model and Experiment Accurately: A Discrete Element Model and Magnetic Resonance Measurements of a 3D Cylindrical Fluidized Bed

Tuesday, November 5, 2013: 4:45 PM
Continental 6 (Hilton)
Christopher M. Boyce1, Daniel J. Holland1, Stuart A. Scott2 and John S. Dennis1, (1)Department of Chemical Engineering and Biotechnology, University of Cambridge, Cambridge, United Kingdom, (2)Department of Engineering, University of Cambridge, Cambridge, United Kingdom

Abstract:

Despite the widespread practical importance of fluidized beds, the underlying physics of these systems is still not well understood [1]. This lack of understanding is due in part to the fact that fluidized beds are difficult to measure because they are opaque, and non-intrusive measurement techniques such as magnetic resonance (MR) must be employed. Additionally, granular matter in fluidized beds can possess gas-, liquid-, and solid-like properties [2], making it very difficult to model accurately. In order to predict the behaviour of fluidized beds, two characteristics must be modelled properly: (1) the contact forces between the particles and (2) the interaction forces between the particles and the fluid. The difficulties in measuring and modelling granular systems potentially lead to experimental results and simulations with a combination of known and unknown inaccuracies. Thus, in order to cross-validate these models and measurements, it is important to compare their results in as direct a manner as possible. This paper describes the cross-validation of a computational model and magnetic resonance measurements of a 3D cylindrical bubbling fluidized bed; the model was processed in a manner that simulated the acquisition process of the experiment to provide a direct comparison between the two.

A discrete element model (DEM) to simulate individual particles combined with computational fluid dynamics (CFD) to model fluid flow was used here to simulate a bubbling fluidized bed. The authors developed a 3D cylindrical DEM-CFD model by integrating a discrete element model in which particles are tracked in rectangular coordinates and contained by tubular walls with a CFD grid modelled in cylindrical coordinates. A novel structured CFD grid, shown in Figure 1, was setup such that the volumes of the fluid cells were kept constant and of similar shape, to ensure the volume-averaged fluid equations for modelling unresolved fluid flow around particles [3], were satisfied. The accuracy of a DEM-CFD model is unclear because of inherent assumptions and inaccuracies in parameters describing the contact mechanics between particles as well as a drag law describing the force of interaction between fluid and particles.

Thus, the DEM-CFD model required validation by experiment. Magnetic resonance (MR) was chosen for experimental comparison because it has proven effective at measuring a variety of physical aspects of fluidized beds [4,5,6], it does not require tracer particles, and it can make measurements on 3D cylindrical fluidized beds. An inherent problem of MR is the complex and indirect tomographic measurement techniques it requires. It is unclear how the mathematical sampling and post-processing methods used to convert the raw MR measurements into images, and derived quantities such as particle velocity, affect the results of measurements on dynamic systems such as fluidized beds. Thus, it is desirable to cross-validate MR measurements by comparison with computational models.

In this study, the DEM-CFD model developed was used to simulate an MR experiment measuring time-averaged particle velocity in a bubbling fluidized bed, conducted by Holland et al. [7]. The time averaged velocity was measured in the x-z plane with a 5 mm slice in the y-direction at the centre of a 44 mm diameter bed, as shown in Figure 2. The bed contained 1.2 mm diameter particles with a settled height of 30 mm and was fluidized at twice the minimum fluidization velocity, 2 U/Umf. In the experiment, a pulse sequence of magnetic field gradients, shown in Figure 3, was used to manipulate MR signal from oil contained in poppy seeds and ultimately measure the time-averaged velocity of the particles over an acquisition time of ~30 minutes. This same pulse sequence was simulated on the particle positions output from the DEM-CFD model over a timespan compressed to 20 seconds, in order to directly compare the results measured by model and experiment.

Additionally, other, simpler averaging techniques were applied to the particle positions and velocities output from the DEM-CFD simulation to provide a comparison with the MR-type acquisition and averaging procedure. A frame-based technique averaged together the average particle velocity in individual pixels at “frames” in time, separated by 10 ms intervals, over the total simulation time. In contrast, particle-based averaging techniques gave equal weighting to the velocity of each particle which passed through a pixel. The MR-type average was expected to be closer to a particle-based average, since MR signal is proportional to the volume of the particle from which it is produced. However, it was unclear how far other complications in the MR acquisition process would cause the MR-type average to deviate from a particle-based average in a dynamic fluidized bed system and how far this average would deviate from a frame-based average. Additionally, since technical complications in MR required signal from particles to be weighted by a 5 mm Gaussian slice, shown in Figure 3, as compared to being bounded by a simple 5 mm “top-hat” slice, a particle-based average was conducted with both of these slices to see how the different slices affected the final average.

Figure 4 shows a comparison between the experimental MR results for time averaged particle velocity and those from the DEM-CFD simulation with the simulated MR pulse sequence. The model and measurements are cross-validated by the similarity in velocity profiles. Notably, the experimental profile extends further upward in the bed and has a higher maximum particle speed than the DEM-CFD velocity profile. These differences can be attributed to inaccuracies in modelling the fluid-particle interaction force: spherical particles were used in the DEM-CFD simulation, giving them a lower surface-area-to-volume ratio than the non-spherical poppy seeds used experimentally and thus a lower drag force. Additionally, the drag correlation of Beetstra et al. [8] used here has been demonstrated to significantly underestimate the average drag force on particles in a fluidized bed [9].

Figure 5 provides a comparison between the different averaging techniques used to time-average particle velocity from the DEM-CFD data. The comparison shows very little difference between MR-type averaging, particle-based averaging with a 5 mm top-hat slice, and particle-based averaging with a Gaussian-weighted 5 mm slice. Thus, this comparison shows that, despite the complex acquisition and processing procedure, MR measurements do provide a particle-based time average in dynamic systems and a 5 mm Gaussian slice yields equivalent results to a 5 mm top-hat slice in these systems. Additionally, the frame-based average provides a similar velocity profile, yet much greater upwards and downwards particle speeds than the other averages. This demonstrates that different averaging techniques on the exact same data can yield vastly different results. Thus, great care should be taken when comparing results from different modelling and measurement techniques for cross-validation, as it may be the averaging technique, as opposed to validity of the techniques, which causes discrepancies.

References

[1] P. G. de Gennes, Rev. Mod. Phys. 71, S374 (1999).

[2] H. M. Jaeger, S. R. Nagel, and R. P. Behringer, Rev. Mod. Phys. 68, 1259 (1996).

[3] T. B. Anderson, and R. Jackson, Industrial & Engineering Chemistry Fundamentals 6, 527 (1967).

[4] C. R. Müller, J. F. Davidson, J. S. Dennis, P. S. Fennell, L. F. Gadden, A. N. Hayhurst, M. D. Mantle, A. C. Rees, and A. J. Sederman, Chemical Engineering Science 62, 82 (2007).

[5] C. R. Müller, J. F. Davidson, J. S. Dennis, P. S. Fennell, L. F. Gadden, A. N. Hayhurst, M. D. Mantle, A. C. Rees, and A. J. Sederman, Phys. Rev. Lett. 96, 154504 (2006).

[6] D. J. Holland, C. R. Müller, J. F. Davidson, J. S. Dennis, L. F. Gladden, A. N, Hayhurst, M. D. Mantle, and A. J. Sederman, Journal of Magnetic Resonance 187, 199 (2007).

[7] D. J. Holland, C. R. Müller, J. S. Dennis, L. F. Gladden, and A. J. Sederman, Powder Technology 182, 171 (2008).

[8] R, Beetstra, M. A. van der Hoef, and J. A. M. Kuipers, Chemical Engineering Science 62, 246 (2007).

[9] S. H. L. Kriebitzsch, M. A. van der Hoef, J. A. M. Kuipers, Chemical Engineering Science 91, 1 (2013).

Figures:
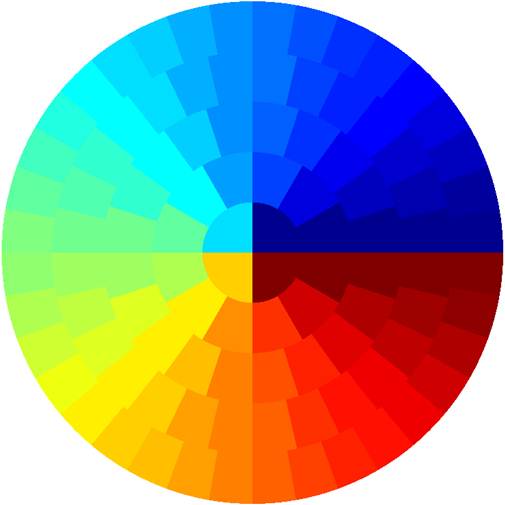
Figure 1 (Colour online) Horizontal cross section of novel CFD grid. Different colours denote different CFD cells. More CFD cells are used in the annuli further from the centre, such that the fluid cells have a constant volume to ensure the same accuracy in the volume-averaged fluid equations.
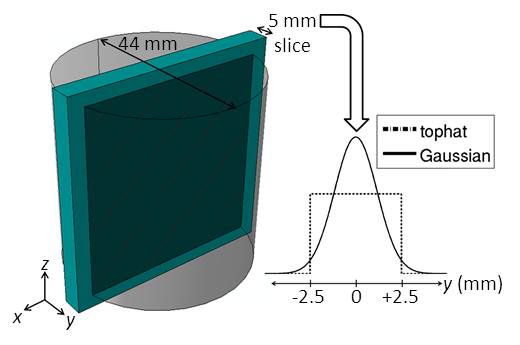
Figure 2 (Colour online) Plot of 5 mm y-slice in fluidized bed (left). Plot of Gaussian and top-hat signal weighting functions versus y-position in the fluidized bed (right).
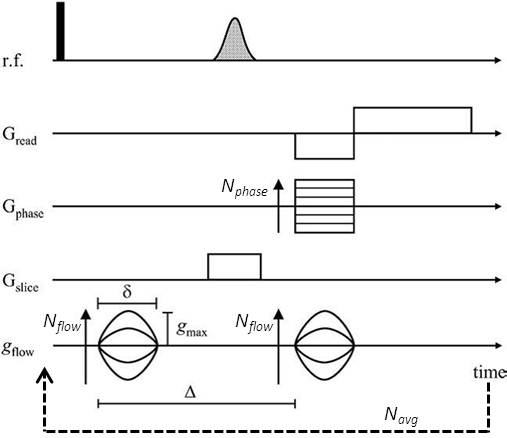
Figure 3 Pulse sequence modelled for MR-type post processing of time averaged axial velocity measurements (Reproduced from Holland et al. [7]).
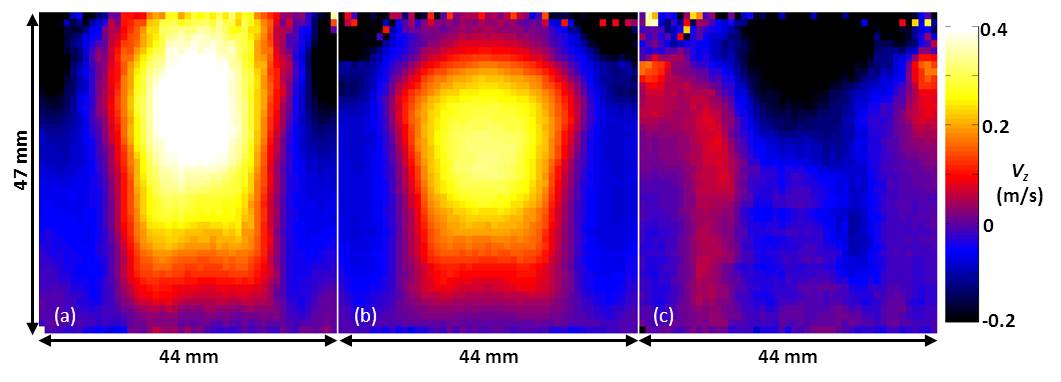
Figure 4 (Colour online) Comparison of average axial velocity images from: (a) experimental MR imaging [5] and (b) MR-type post-processing of the DEM simulation. Image (c) gives the difference map between (b) and (a). The resolution of each image is 1.04 mm (z) by 0.94 mm (x).
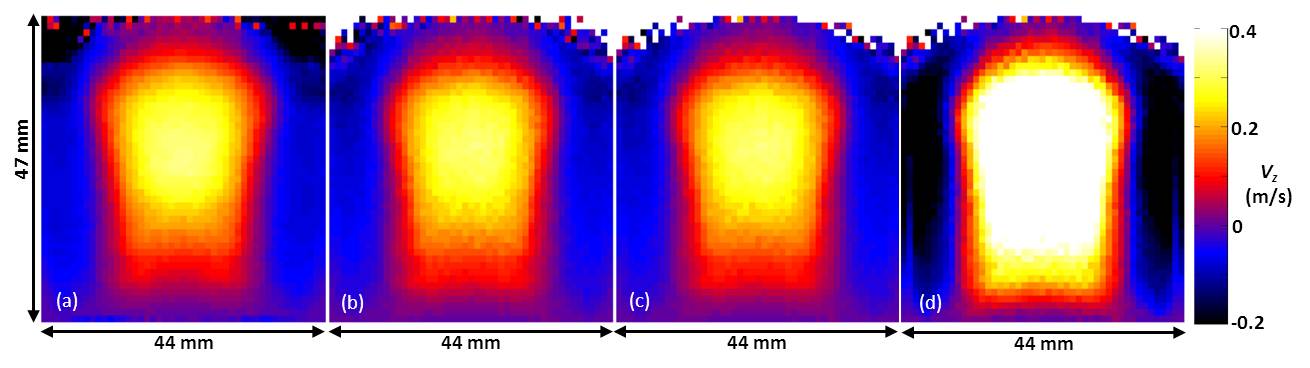
Figure 5 (Colour online) Comparison of average axial velocity images of DEM simulation with different averaging methods: (a) MR-type post-processing, (b) Gaussian-slice particle-based average, (c) “top-hat” slice, particle-based average, and (d) frame-based average. The resolution of each image is 1.04 mm (z) by 0.94 mm (x).


Extended Abstract: File Not Uploaded