
 Google
 Yelp
 Facebook
 Twitter
 ChEnected
311607 Endothelial Cells Migrate Upstream and Align Against the Shear Stress Field Created By Impinging Flow
Endothelial Cells Migrate Upstream and Align Against the Shear Stress Field Created by Impinging Flow
Spatial gradients in wall shear stress have emerged as an important factor for cardiovascular development and disease. High shear and vortical flow were required for normal heart development in zebrafish, where occluded flow results in an abnormal third chamber.1 Large shear stress gradients likewise exist in the heart tube of the developing quail embryo, where high localized shear stresses in the outflow tract coincide with the future locations of aortic and pulmonary valve formation.2,3 ECs lining the aortic valve leaflets, where high shear stress gradients occur, align perpendicular to flow and may reflect a response to the high shear stress present in the left ventricle.4 Importantly, the mechanisms underlying ECs response to spatial gradients in wall shear stress remain essentially unknown. In order to study the influence of shear stress gradients on endothelial cell response, we built an impinging flow cell that exposes endothelial cells to a gradient of shear stress whose slope can be tuned by changing the flow rate. We investigated the response of endothelial cells to shear stress gradients that ranged from 0 to a peak shear stress of between 9-220 dynes/cm2.
Materials and Methods
We built an impinging flow cell that exposes endothelial cells to a gradient of shear stress. The impinging flow cell device is used to produce gradients in shear stress while imaging the cellular migration and reorientation over a 21-hour period. A photo of the device is shown in Fig. 1a. The device was fabricated out of acrylic in order to enable live-cell imaging by allowing light to pass through the transparent device and illuminate the cells while tracking their response to impinging flow. The device is mounted on an x-y-z translation stage suspended at a fixed height of 1 mm over a cell culture dish seeded with ECs. The impinging flow exit orifice is oriented normal to the EC surface and dispenses fluid (cell culture media) onto the EC monolayer seeded on a cell culture dish The orifice radius is 0.35 mm. A pump is used to recirculate cell culture media onto the cell surface.
(a) (b) (c)
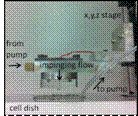
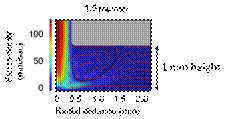
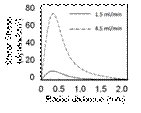
Figure 1. Device design and modeling of impinging flow cell. (a) Impinging flow cell device is used to produce gradients in shear stress while imaging the cellular migration and reorientation. The fluid flow enters the impinging flow chamber shown at the left and impinges onto the cell culture dish normal to the cell surface. Fluid leaves the dish at the same rate through a tube located at the edge of the dish via recirculation by a peristaltic pump (b) Velocity flow field from finite element analysis performed in Comsol shown in vertical cross section for flow through an impinging flow cell. Flow rate of 1.5 mL/min for an orifice with a 0.35 mm radius located 1 mm above the cell surface is modeled. Fluid velocity magnitude is represented with color, fluid direction with arrows and flow streamlines with black lines. The conditions show a low flow region (depicted in blue) at r = 0 and far from the orifice. The inlet flow rate corresponds to jet Reynolds numbers of 67 and demonstrates that the flow is in the laminar regime. (c) Wall shear stress on the cell culture dish is plotted as a function of radius from the impinging flow. Shear stress ranges from zero (at r = 0) directly under the exit of the impinging flow cell orifice (the stagnation point) and increasing symmetrically and radially outward to a maximum at a distance of 0.350 mm. The region of maximum in shear stress is radially symmetric and corresponds to the radius of the impinging exit orifice. Shear stress values from the analysis are plotted for flow rates of 1.5 mL/min and 4.5 mL/min.
Results
At high confluency, endothelial cells migrate against the direction of fluid flow for all flow rates tested and concentrate in the region of maximum wall shear stress, while sub-confluent endothelial cells migrate with the flow direction. In addition, endothelial cells align parallel to the flow at low wall shear stresses but orient perpendicular to the flow direction and in a densely packed arrangement above a critical threshold in local wall shear stress as shown in Fig. 2b, within region 2.
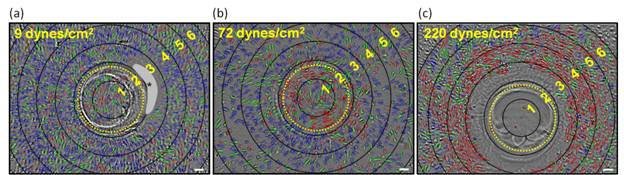
Figure 2. Orientation analysis of HMVEC's exposed to flow in the impinging flow cell for 21 hours. The peak location in shear stress is shown as a yellow dashed ring. Cells have been colored to clearly observe their long axis with respect to the fluid flow direction. Blue indicates EC alignment parallel with flow, red is perpendicular to flow, and green is intermediate orientation. Blank lines indicate concentric rings with a spacing of 0.185 mm to show axisymmetric cell response. (a) Image of HMVECs exposed to 1.5mL/min flow producing peak WSS of 9 dynes/cm2. Cells beyond the shear stress maximum are primarily oriented with flow (regions 3, 4 and 5), while cells in the stagnation region (region 1) are predominantly unaligned. Gray region with '*' represents an area where valid EC images were not obtained because of poor contrast. (b) HMVECs exposed to impinging flow rate of 4.5 mL/min with maximum shear stress of 72 dynes/cm2. Cells in the vicinity of the wall shear stress maximum (region 2) are predominantly oriented perpendicular to flow (red), while cells beyond this region are oriented parallel (blue) to the flow. (c) HMVECs exposed to 9 mL/min flow with peak WSS of 220 dynes/cm2. Cells in regions 1, 2, and much of 3 were ablated due to high shear stress. Cells in regions 3-5 oriented perpendicular to flow. Scale bars equal 100 µm.
Our observations suggest that endothelial cells are exquisitely sensitive to both the magnitude and spatial gradients in wall shear stress. The perpendicular reorientation of ECs at high shear stress values agrees with in vivo data where ECs are observed to orient perpendicular to flow at the valve leaflet where shear stress is high. Their resulting migration and polarization may play presently unrecognized roles both during cardiovascular development and disease, particularly in regions of complex flow. The mechanisms underlying these responses may additionally play important roles during development, where high shear and large gradients exist transiently during heart development.
1. Hove, J. R. et al. Intracardiac fluid forces are an essential epigenetic factor for embryonic cardiogenesis. Nature (2003).
2. Peterson, L. M. et al. 4D shear stress maps of the developing heart using Doppler optical coherence tomography. Biomed Opt Express 3, 3022-3032 (2012).
3. Garita, B. et al. Blood flow dynamics of one cardiac cycle and relationship to mechanotransduction and trabeculation during heart looping. Am J Physiol Heart Circ Physiol 300 (2011).
4. Deck, J. D. Endothelial cell orientation on aortic valve leaflets. Cardiovasc Res 20, 760-767 (1986).
See more of this Group/Topical: Engineering Sciences and Fundamentals