
 Google
 Yelp
 Facebook
 Twitter
 ChEnected
320509 Analysis of Nonuniformity of Methanol-Water Mixture in Sub- and Supercritical State Via MD Simulation
Analysis of Nonuniformity of Methanol-Water Mixture in Sub- and Supercritical State via MD Simulation
Takumi Ono, Masaki Ota, Yoshiyuki Sato and Hiroshi Inomata
Research Center of Supercritical Fluid Technology, Tohoku University, Sendai, Japan
Abstract
Alcohol-water mixtures exhibit
interesting anomalies in their macroscopic properties. Introduction Alcohol-water mixtures are
scientifically intriguing and important for many fields ranging from basic
molecular research to widespread industrial. Simple alcohol such as
methanol or ethanol and water mix incompletely, which is a phenomenon described
in terms of negative excess entropy [1, 2]. This well-known effect has been attributed to hydrophobic
headgroups creating ice-like or clathrate-like structures in the surrounding water.
Related to the inhomogeneous mixing, furthermore, distinct solvation regimes as
a function of alcohol concentration have been experimentally reported [3]. This
indicates that alcohol-water mixtures have nonuniformity at the molecular level.
The fact that even sub- and supercritical water the hydrogen bonding still
exists is reported [4, 5]. It is expected that inhomogeneous structure attributed by
the hydrogen bonding is also influenced by temperature and pressure effects.
For the purpose of solution structure analysis of methanol-water mixture and effect
of temperature and pressure, some physical properties of alcohol-water mixture
were measured at high temperature and pressure including sub- and supercritical
condition [6-8]. Since the hydrogen bonding structures affect the density, our
group has measured the density of methanol-water mixture and performed
molecular dynamics simulation for understanding of the relationship between the
macro and micro properties at 300 ~ 400 °C, high pressure condition [9]. However,
still no consensus exits on the precise microscopic picture at the molecular
level. In particular, the study of degree of nonuniformity in mixture is scarce.
In this work, we calculated the distribution of molecular arrangement of methanol-water
mixtures in ambient, sub- and supercritical states using molecular dynamics
simulation to discuss the nonuniformity at the molecular level.
Computational details The molecular models used in this
study were the 3-sites flexible models proposed by Liew et al. [10] for water and by Honma et al. [11] for
methanol. Both models can represent the PVT and saturated
properties of the fluid in the liquid and supercritical state. The three
sites for methanol are oxygen (O), hydrogen (H) and methyl group (-CH3).
Both flexible models were formulated as a sum of intra- and intermolecular
potential by using the angular form of the Toukan-Rahman (TR) potential [12]. The intermolecular potential used a Lennard-Jones (LJ) 12-6
potential and a Coulombic potential. Unlike interactions were computed
using the Lorentz-Berthelot combination rule.
The LJ and Coulombic potential parameters for
water and methanol were those given in the original studies [10, 11]. All simulations were performed with NVT-ensembles for
several methanol mole fractions. The conditions in the simulation were
set in the 25, 300, 400 °C and the number density N / V was set
to the experimentally determined densities (0.1, 25MPa) [9, 13] to allow isobaric analysis at any given temperature. The
total number of molecules was 2048. The temperature was initially (~ 60
ps) controlled by momentum scaling and afterwards (60 ps ~) by the Nosè-Hoover
thermostat for computational stability. The equation of motion was
integrated using the velocity Verlet technique. Time steps were 1 fs for
the intermolecular motion and 0.2 fs for the intramolecular motion.
Statistical sampling in the simulation was done for 600 ps after 100 ps
equilibration.
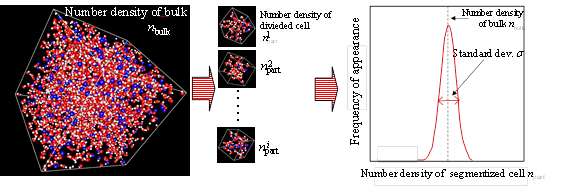
Definitions of Nonuniformity We divided into the computational
cell to cubes of X Å and counted the number density n of methanol
and water molecules of each divided cells to evaluate the nonuniformity of
mixture. Figure 1 shows the schematic diagram of the evaluation of
nonuniformity for methanol-water mixture. We performed above sampling at
50 fs intervals and calculated the standard deviation of the n of the
molecules in the divided cells to evaluate the nonuniformity of the methanol-water
mixtures.
Figure 1
Schematic diagram of the evaluation of nonuniformity for methanol-water
mixture.
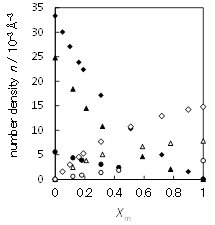
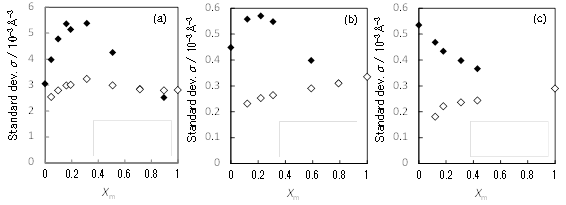
Results and discussions Figure 2 and 3 show n for
each molecules in bulk and standard deviation of n for each molecules as
a function of methanol composition in a 8 Å divided cubic cell (X = 8Å).
The standard deviations of each component at 25 °C - 0.1 MPa and water molecule
at
Figure 2 Xm
dependence of the number density n of for methanol (open symbols) and
water (filled symbols) in bulk: 25 °C-0.1MPa (diamonds),
300°C-25MPa (triangles), 400 °C-25MPa (circles).
Figure 3 Xm
dependence of the standard deviation s of number density n
distribution for water and methanol at (a) 25 °C-0.1MPa, (b) 300°C-25MPa,
(c) 400 °C-25MPa: methanol (open diamond) and water (filled diamonds).
300 °C - 25 MPa have maximum around methanol
composition Xm = 0.2 ~ 0.3 although n value
in bulk monotonously varied with composition. However this maximum was
not observed in methanol at 300 °C - 25 MPa and both molecules at 400 °C - 25
MPa. The fact that effects of hydrophobic hydration, so-called "ice-like"
or "clathrate-like", are remarkable in low Xm has been
reported [14], hence this maximum suggests that inhomogeneous spatial
distributions of the molecules caused by the inhomogeneous solution structure exist
from the microscopic point of view. In addition, even under high
temperature and pressure, such as 300 °C - 25 MPa, the inhomogeneous local
structures proved to be remaining. On the other
hand, we assumed that these non-uniform local structures cannot be maintained at 400 °C - 25 MPa because of intense thermal motion
of molecules.
References [1]
F. Franks, D.J.G. Ives, Quarterly Reviews, 20 (1966) 1-&. [2]
F. Franks, J.E. Desnoyers, Water Science Reviews, 1 (1985) 171-232. [3]
T. Sato, A. Chiba, R. Nozaki, J. Chem. Phys., 112 (2000) 2924-2932. [4]
Y. Ikushima, K. Hatakeda, N. Saito, M. Arai, J. Chem. Phys., 108 (1998) 5855-5860. [5]
M.M. Hoffmann, M.S. Conradi, J. Am. Chem. Soc., 119 (1997) 3811-3817. [6]
E. Bulemela, P. Tremaine, S. Kawa, Fluid Phase Equilib., 245 (2006) 125-133. [7]
C.B. Xiao, H. Bianchi, P.R. Tremaine, Journal of Chemical Thermodynamics, 29
(1997) 261-286. [8]
D.T. Safarov, A.N. Shakhverdiev, High Temp., 39 (2001) 395-400. [9]
T. Ono, S. Kobayashi, T. Hoshina, Y. Sato, H. Inomata, Fluid Phase Equilib.,
302 (2011) 55-59. [10]
T. Honma, C.C. Liew, H. Inomata, K. Arai, J. Phys. Chem. A, 107 (2003) 3960-3965. [11]
T. Honma, S. Kuzuhara, C.C. Liew, H. Inomata, Fluid Phase Equilib., 194 (2002)
271-280. [12]
K. Toukan, A. Rahman, Physical Review B, 31 (1985) 2643-2648. [13]
M. Iglesias, B. Orge, J. Tojo, Fluid Phase Equilib., 126 (1996) 203-223.
 (1)
 (2)
See more of this Group/Topical: Engineering Sciences and Fundamentals