
 Google
 Yelp
 Facebook
 Twitter
 ChEnected
331066 Simultaneous Purification and Fractionation of Nucleic Acids and Proteins From Complex Samples Using Isotachophoresis
harp counter migrating bands. (Bottomng by ion by using
SIMULTANEOUS PURIFICATION AND FRACTIONATION OF NUCLEIC ACIDS AND PROTEINS FROM COMPLEX SAMPLES USING ISOTACHOPHORESIS
Yatian Qu, 1 Lewis A. Marshall, 2 Juan G. Santiago1
1 Department of Mechanical Engineering, Stanford University
2 Department of Chemical Engineering, Stanford University
Stanford, CA 94305, USA
We report on the development of a novel integrated sample preparation technique to simultaneously extract nucleic acids and proteins from complex biological samples using isotachophoresis (ITP). ITP is an electrophoretic technique that both separates and pre-concentrates ions based on their electrophoretic mobility. ADDIN EN.CITE <EndNote><Cite><Author>Persat</Author><Year>2009</Year><RecNum>10</RecNum><DisplayText><style Marshall, L.A., Santiago, J.G.</author></authors></contributors><titles><title>Purification of Nucleic Acids from Whole Blood Using Isotachophoresis</title><secondary-title>Analytical Chemistry</secondary-title></titles><periodical><full-title>Analytical Chemistry</full-title></periodical><pages>9507-9511</pages><volume>81</volume><number>22</number><dates><year>2009</year></dates><urls></urls></record></Cite></EndNote>1 Our chip contains a single input sample reservoir connected to two channels leading to output reservoirs. Anionic ITP in one channel is used to extract and purify DNA and deliver it to the DNA output reservoir. Simultaneously, the second channel uses cationic ITP to extract and purify proteins, preserving their natural folding state. Purified DNA and proteins are thereby fractionated and delivered to respective output reservoirs. The protein extraction can be configured to exclude albumin, a highly abundant species with little analytical value. The DNA is purified away from species that inhibit enzymatic amplification such as polymerase chain reaction (PCR).
We designed and fabricated the novel microfluidic device shown in Figure 1 to demonstrate the technique. The device is fabricated from polydimethylsiloxane (PDMS) and glass and includes two "C" shaped channels leading from a single sample input reservoir at the center. The channels are 1 mm wide and 100 μm deep, with a volume of 4 μL for each branch. Each of two branches leading form the center is about 40 mm long. The cationic ITP channel collects positively charged protein species. The anionic ITP channel collects nucleic acids, which are strongly negatively charged. Each branch has its own elution reservoir, where the collected biomolecules can be pippetted off the chip. Each elution reservoir is also connected to a buffering channel and reservoir to provide additional pH-buffering capacity.
We successfully demonstrated simultaneous extraction of extracellular DNA and proteins from 1 μL human serum samples. We optimized the buffer chemistry for this system by performing numerical simulation using Stanford Public Release Electrophoretic Separation Solver (SPRESSO), as shown in Figure 2. We visualized the process in a small version of the separation device in order to obtain a series of images that capture the dynamics of the ITP sample zone in both branches, and show these images in Figure 3. For purification experiments, we imaged focused nucleic acids zone (Figure 4) by using fluorescent dye TOTO-3. The focused protein zone (Figure 5) was monitored by imaging spiked yellow fluorescent protein (YFP).
To verify the purification of nucleic acids, we performed quantitative polymerase chain reaction (qPCR) using primers for the human gene BRAC2 (Figure 6). Even though human serum contains low abundance of extra-cellular DNA, ADDIN EN.CITE <EndNote><Cite><Author>O'Driscoll</Author><Year>2007</Year><RecNum>8</RecNum><DisplayText><style Article">17</ref-type><contributors><authors><author>Lorraine O'Driscoll</author></authors></contributors><titles><title>Extracellular Nucleic Acids and their Potential as Diagnostic, Prognostic and Predictive Biomarkers</title><secondary-title>Anticanser Research</secondary-title></titles><periodical><full-title>Anticanser Research</full-title></periodical><pages>1257-1266</pages><number>27</number><dates><year>2007</year></dates><urls></urls></record></Cite></EndNote>2 ITP successfully recovered sufficient material to detect this gene via qPCR. Unprocessed serum shows no amplification in qPCR, as expected due to the effects of PCR inhibitors present in serum such as immunoglobulin G (IgG). To analyze the extracted proteins, we performed sodium dodecyl sulfate polyacrylamide gel electrophoresis (SDS-PAGE) followed by silver staining. We compared samples extracted via ITP with samples directly applied to the gel, as shown in Figure 7. We recovered a wide variety of proteins from the original sample, and successfully excluded albumin.
Simultaneous extraction and purification of nucleic acids and proteins from a single crude biological sample is important for ensuring comparability between genomic and proteomic results, and to conserve precious samples. ADDIN EN.CITE <EndNote><Cite><Author>Butt</Author><Year>2007</Year><RecNum>3</RecNum><DisplayText><style Article">17</ref-type><contributors><authors><author>Butt, R. H., Pfeifer, T.A., Delaney, A., Grigliatt, T.A., Tetzlaff, W.G., Coorssen, J.R.</author></authors></contributors><titles><title>Enabling Coupled Quantitative Genomics and Proteomics Analyses from Rat Spinal Cord Samples</title><secondary-title>Molecular & Cellular Proteomics</secondary-title></titles><periodical><full-title>Molecular & Cellular Proteomics</full-title></periodical><pages>1574-1588</pages><number>6</number><dates><year>2007</year></dates><urls></urls><electronic-resource-num>10.1074/</electronic-resource-num></record></Cite></EndNote>3 To our knowledge, our technique is unique in offering availability of automated and simultaneous nucleic acids and protein extraction in microfluidics platforms.
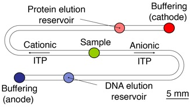
Figure 1. Device design for simultaneous purification of nucleic acids and proteins from serum using simultaneous cationic and anionic ITP processes. Each reservoir holds approximately 8 µL liquid. Each separation channel has a volume of 4 µL.
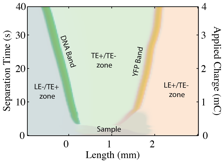
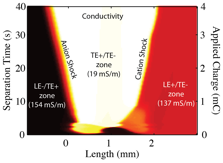
Figure 2. Spatiotemporal representation of numerical simulation results. (Top) Ion concentrations: each ion is given its own false color. Over time, the DNA and proteins focus into sharp counter migrating bands. (Bottom) Conductivity map: low conductivity causes high electric field in the TE zones; fast ions quickly migrate out.
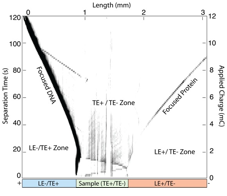
Figure 3. Experimental data plotted in a spatiotemporal plot showing the dynamics of protein and DNA zones purified in our chip. Yellow fluorescent protein and DNA labeled with SYBR Green I were imaged using a custom fluorescence set up using a stereoscope. The DNA and protein zones are clearly visible propagating away from the sample zone.
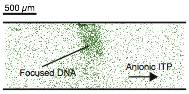
Figure 4. Fluorescent image of DNA labeled with TOTO-3 in the ITP zone. DNA migrates toward the anode.
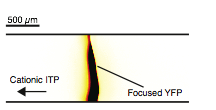
Figure 5. Fluorescent image of YFP in the cationic ITP zone. YFP migrates toward the cathode.
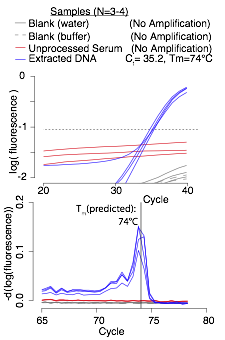
Figure 6. qPCR results: extracted nucleic acids were amplified using primers for a 201-bp section of the BRAC2 gene in the human genome. The extracted DNA samples amplified, while control samples of water and unprocessed serum did not. The resulting amplicons had a melting temperature of 74°C, which matches the prediction from the Promega amplicon melting tool. ADDIN EN.CITE <EndNote><Cite><Author>Promega</Author><RecNum>9</RecNum><DisplayText><style Page">12</ref-type><contributors><authors><author>Promega</author></authors></contributors><titles></titles><dates></dates><urls><related-urls><url>http://www.promega.com/resources/tools/biomath-calculators/ </url></related-urls></urls></record></Cite><Cite><Author>Promega</Author><RecNum>9</RecNum><record><rec-number>9</rec-number><foreign-keys><key app="EN" db-id="xw220stpa9fwf6e25zsvxseksdx5wedtz9e2">9</key></foreign-keys><ref-type name="Web Page">12</ref-type><contributors><authors><author>Promega</author></authors></contributors><titles></titles><dates></dates><urls><related-urls><url>http://www.promega.com/resources/tools/biomath-calculators/ </url></related-urls></urls></record></Cite></EndNote>4
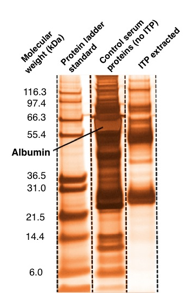
Figure 7. Silver-stained SDS-PAGE of original serum sample, and proteins extracted using ITP. We recover at least 17 visible protein bands over a range of molecular weights. Protein bands below 21.5 kDa are faint but detectable. Albumin is the most concentrated band in the serum sample, but is not visible in the selectively extracted sample.
See more of this Group/Topical: 2013 Annual Meeting of the American Electrophoresis Society (AES)