
 Google
 Yelp
 Facebook
 Twitter
 ChEnected
335203 Modeling Dust Explosions
Introduction
Dust explosions are a major safety topic, on every plant, that handles flammable granular or pulverized substances. Commonly dusts are characterized by two scalars, the maximum explosion pressure and the maximum rate of pressure rise. With that method it is not possible to know how the flame front and the pressure act in the geometry. When a description of the behavior of a dust explosion in the geometry is needed, a CFD (Computational Fluid Dynamics) model, which can describe the physics of a dust explosion, has to be used
For the modeling of gas explosion, two types of combustion models are common. On the one hand chemical and mixture limited reaction models like the eddy dissipation concept, on the other hand flame speed approaches. To model the dust explosion with a chemical and mixture limited reaction model, the pyrolysis of the dust has to be characterized. The calculation of the pyrolysis in the dust particles needs a kinetic and enormous computing recourses.
If a flame speed approach is used, the durst can be characterized by the laminar flame speed and the burnable fuel fraction as function of the dust concentration and the heat of combustion. The flame speed approach is also relatively cheap in terms of computing resources.
So a CFD code to model dust explosions, which is based on a flame speed approach was developed. This solver is based on the XiFOAM solver of the software package OpenFOAM.
Description of the model
Basic concept
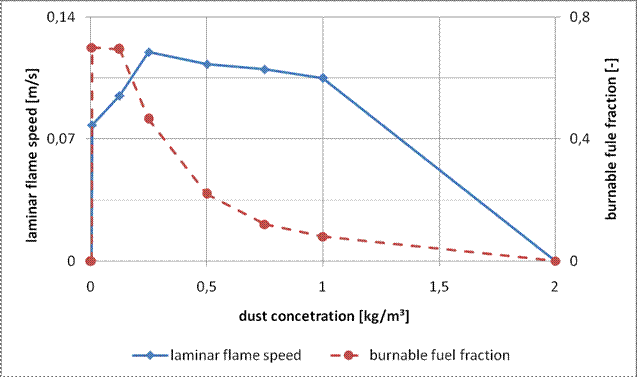
The key parameter is the turbulent flame speed, which is highly depended to the turbulence and also depends on the laminar flame speed. The laminar flame speed is a function of the dust concentration. These values are based on measurements with a Siwek 20-liter vessel. With the pressure time curve from the experiment, the laminar flame speed can be calculated, shown by Skjold [1]. It is also possible to calculate the burnable fuel fraction by energy balancing. Figure 1 shows the laminar flame speed and burnable fuel fraction of lycopodium as function of the concentration.
The influence of the turbulence on the flame speed follows the description of Dahoe [2].
Particle and gas motion To
describe the movement of the dust particles an Eulerian approach was chosen
because of the high particle count. In bigger geometries a Lagrangen approach
is too expensive in terms of computing resources. The exchange
coefficient for momentum K is based
on the work of Syamlal [3] and the drag coefficient, to calculate is described
by the Schiller Neuman approach [4]. The granular pressure ps and the granular temperature are computed by an analytical
published by Syamlal [5]. Equation
1 describes the momentum equation of the gaseous phase and equation 2 the
momentum equation of the particle phase.
Equation
3 and 4 show the continuity equation. The source term on the right side,
describes the mass transfer between the phases through the combustion process.
A
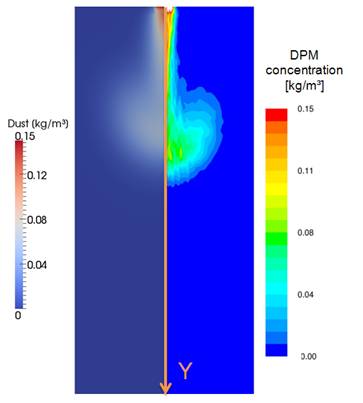
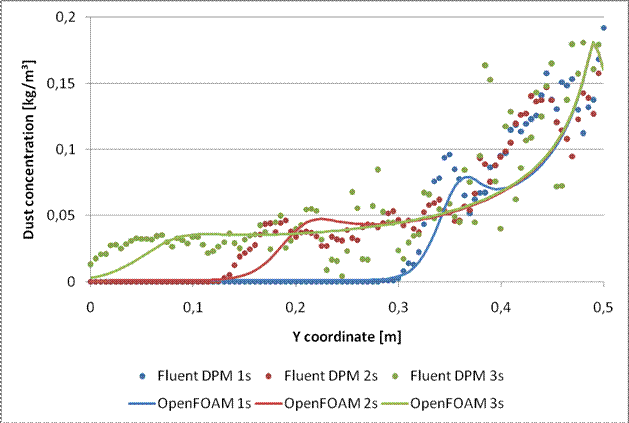
comparison between the used Eulerian and the Fluent DPM model is shown in
figure 3. In a simple 2D geometry, shown in figure 2 particles where injected.
The curves in figure 3 show the dust concentration on the Y axis after
different times.
Turbulence modeling Early
simulations had shown that the in OpenFOAM implemented RANS fail. The reason
for that is the high relative velocity in front of the flame front. The high
relative velocity generates turbulent kinetic energy behind the particles. To
model this effect an additional source tem, based on the consistent approach of
Crowe [6] was implemented in the k equation of the standard k-e model. Equation
5 shows the modified k equation.
Combustion model Like in every flame speed approach the state of
combustion is defined by a progress variable, in this case called C. If C has a value of 1 the dust-air mixture is unburned. For a burned
mixture C has a value of 0. The
source tem of conservation equation for C, which is shown in equation 6,
includes the laminar flame speed, the variable Bsh, which describes the ratio between the laminar and the
turbulent flame speed and the magnitude of the gradient of C. That source term is also used in other equations, to describe
changes based on combustion processes.
Energy Equations To be
able to consider the high relative velocities in front of the flame front, for
each phase a separate energy equation was implemented. The energy equation for
the gaseous phase, shown in equation 7, has two source terms. The first one
describes the energy of combustion based on the heat of combustion, dust
concentration, the burnable fuel fraction and the combustion source term. The
second term describes the energy exchange to the particle phase, based on the
heat exchange coefficient of Ranz-Marshall [4]. The energy
equation for the particle phase, shown in equation 8 has just a storage
function. The source term just describes the energy transfer to the gaseous
phase.
Species Equation The
density of the gas is a very important parameter for expansion. It is based on
pressure, temperature and the molar mass. To describe the molar mass the
variable b was introduced. This
variable describes the off gas- air mixture. The conservation equation for b is shown in equation 9. The source term
is based on a coefficient, dust concentration, the burnable fuel fraction and in
the combustion source term.
Results and comparison to
the experiment To
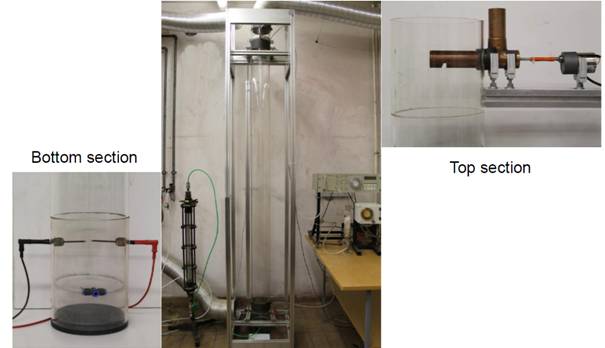
evaluate the model, in house experiments from Kern [7] were used. Figure 4
shows the experimental set up. A screw conveyer delivers a defined amount on dust,
in that case lycopodium, in to a
vertical duct.When the dust gets a constant defined concentration, the
mixture is ignited by an electric spark.
In figure
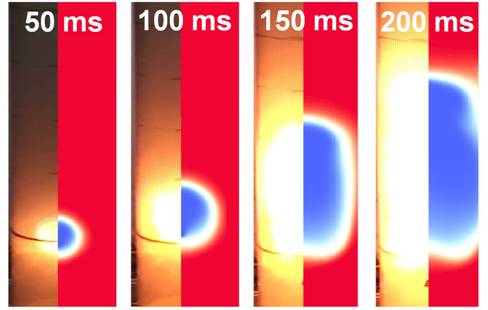
5 the comparison of the flame front between experiment and the model is shown. For
a concentration of 300g/m³ lycopodium.
The model fits well to the experiment in the first 200ms. After that the
results gets different. The reason is that the momentum out of the duct
influences turbulence after 200ms. In the experiment a flame arrester at the
top of the duct and the off gas system has to be used. This parts are not
implemented in the model. In the future, experiments with the duct at another
location are planned, where no flame suppression barrier and the off gas system
is needed.
<>List
of abbreviations
aEff Effective thermal diffusivity t Time b Progress variable off gas- air mixture Tg Temperature gaseous phase Baus Burnable fulefraction Tp Temperature particle phase Bsh Ratio between laminar and turbulent flamespeed Velocity vector gaseous phase C Progress variable flamefront Ulam Laminar flame speed D Dust concentration Velocity vector particle phase eps Dissipation of the turbulent kinetic energie ag,p Heat exchange coefficient Gravity vector Volume fraction gaseous phase HVbr Heat of combustion Stress tensor gaseous phase K Momentum exchange coefficient Stress tensor particle phase p Pressure ρ Density gaseous phase ps Granular pressure ρ unburned Density gaseous phase unburned QVbr Chemical coefficient
<>
<>Literature [1] T.
Skjold, B.J. Arntzen, O.R. Hansen, O.J. Taraldset, I.E. Storvik, R.K. Eckhoff,
Simulating Dust Explosions with the First Version of DESC, Process Safety and
Environmental Protection, Volume 83, Issue 2, March 2005,151–160 [2] A.E., Dahoe, 2000. Dust explosions: a study of
flame propagation, PhD thesis, Delft University of
Technology, Delft, Holland [3] M.
Symlal, J. O'Brain, (1989), “Computer Simulation of Bubbles in a Fluidized
Bed”, AIChE Symp. Series 85, 22-31 [4] FLUENT
(2010), “FLUENT (2003), “Ansys Fluent Theory Guide”, Fluent Inc [5] M. Symlal, J. O'Brain, W.
Rogers, (1993), “MFIX Documentation”, National
Technical Information Service, Springfield, US. [6] C. T.
Crowe, On models for turbulence modulation in fluid-particle, International
Journal of Multiphase Flow 26 (2000) 719-727 [7] H. Kern, K.
Held, H. Raupenstrauch, Investigations on the influence of
the oxygen concentration on the flame propagation in lycopodium/air mixtures, ACHEMA 2012 Frankfurt, June 21st 2012











See more of this Group/Topical: Particle Technology Forum