
 Google
 Yelp
 Facebook
 Twitter
 ChEnected
339567 Automated Image Analysis of Intracellular Lipid Droplets: Toward High-Throughput Screening of Anti-Obesity Agents
Automated Image Analysis of Intracellular Lipid Droplets: Toward High-Throughput Screening of Anti-Obesity Agents
Introduction and Motivation - Cellular hypertrophy of body fat, or white adipose tissue (AT), underlies many of the proposed mechanisms for obesity-related illnesses. In hypertrophic adipocytes, the lipid volume accounts for >90% of cell volume. Thus, an increase in adipose cellular lipid is equivalent to an increase in cellular volume. This direct coupling between cellular morphology and metabolism can be exploited to screen for the effects of agents designed to target specific metabolic pathways by monitoring the dynamics of cellular lipid droplets. Ideally, the lipid droplets are monitored noninvasively to enable repeated observations over time, which can reveal important information regarding the dynamics of lipid droplet formation. An attractive approach for monitoring cellular lipid droplets in cultured adipocytes is to combine optical microscopy and image analysis. In principle, contrast agents such as lipophilic dyes or labeled antibodies for lipid droplet-specific proteins are not required, as there is sufficient contrast between a lipid droplet and the cytoplasm surrounding the droplet. Importantly, forgoing the use of dyes or labels would not only lessen the experimental effort, thus aiding high-throughput analysis, but also reduce the likelihood of introducing additional measurement artifacts into the analysis.
Manual analysis of microscopy images is both time consuming, error prone, and subject to biases. This motivates the development of an automated image analysis algorithm. The major challenges arise from the complexity of the images. In a typical adipocyte culture derived by inducing preadipocytes or other precursor cells, differentiation occurs unevenly, leading to a highly heterogeneous population of cells and lipid droplets. Due to this complexity, relying on a fixed contrast thresholds to identify lipid droplets can lead to inaccurate results (Fig 1B). While manual tuning of the threshold on an image-by-image basis can improve the detection of lipid droplets, the improvement is only marginal, and is obtained at the cost of throughput and potential for bias. In this abstract, we present an image analysis algorithm that is capable of processing a wide range of images with little to no user input, and thus well-suited to high-throughput analysis of lipid droplets in cultured cells.
Image Analysis Algorithm – Our algorithm identifies lipid droplets using four different characteristics of typical adipocyte images: droplets are (1) relatively light, (2) circular, and (3) surrounded by a relatively dark boundary, (4) which is also circular. To take advantage of the first two characteristics, the original grayscale image is converted into black and white images twice: once using a low threshold, and once using a high threshold. Instead of choosing a fixed threshold, our algorithm uses a dynamic threshold value, which adapts to the overall brightness of the entire image. When the high threshold is applied, the light interior of the lipid droplets and some light background noise are converted to white, while the rest of the image becomes black (Fig 2A). When the low threshold is applied, the dark rings surrounding the lipid droplets and some dark noise are converted to black, while the rest of the image becomes white (Fig 2B). By inverting the low-threshold image and filling in the holes, an image results that is white where the dark droplet boundaries (rings) and dark background noise originally were, and black everywhere else. An intersection of the two images yields an image that is white only where the original image was both light and surrounded by a dark boundary (Fig 2C). In addition to accurately identifying the lipid droplets, these processing steps also reduce noise in the image, because dark and light noise cannot occupy the same location in an image. A circle finding algorithm is applied to the low threshold image (Fig 2D and 2E), and the resulting image is then combined with the intersected image to generate the final processed image (Fig 1C).
Image Analysis Results The image analysis processing method was validated against experimental data. We differentiated 3T3-L1 preadipocytes in 12-well plates for 16 days. Every 4 days, we captured 300 images per well, in 6 different wells, then lysed the cells for enzymatic analysis. As expected, accumulated triglyceride increased over time (Fig 3). The image analysis and enzymatic assay data correlated significantly across time point groups (Fig 3A) and individual wells (Fig 3B). However, the correlation was stronger for time point groups (R2=0.99). The weaker correlation for individual wells is likely due to the heterogeneity of adipocyte differentiation. As the images captured represent only a fraction of the total culture surface of a well, it is possible that the captured images do not fully represent all of the cells in the well.
Conclusions We developed a new image processing method to support noninvasive analysis of lipid droplets in cultured adipocytes. This method does not require destruction of the cells for endpoint analysis of cell metabolism or introduction of exogenous dyes or labels. The image analysis results correlate strongly with enzymatic assay data, especially for condition group averages. Prospectively, automated image analysis processing could be use to monitor the dynamics of lipid droplet formation in cells, and establish high-throughput screens for agents designed to affect these dynamics.
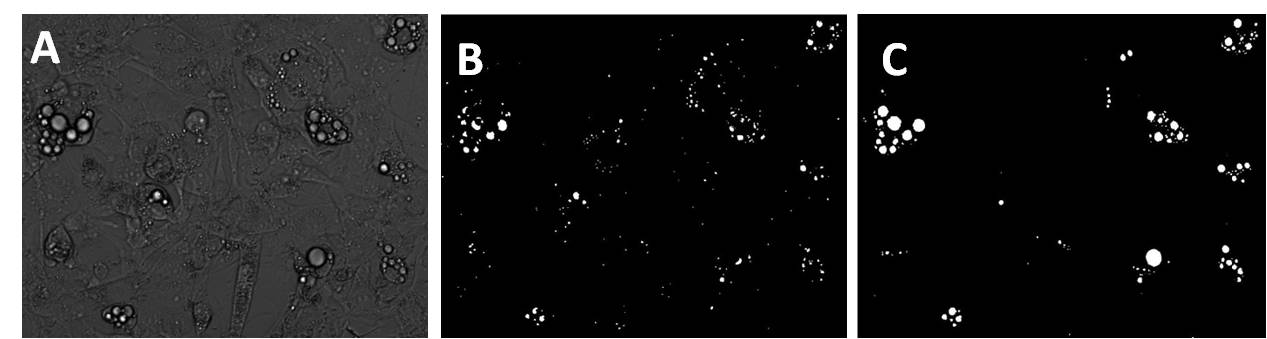 Figure 1: Comparison
of currently available image analysis methods to our new algorithm. Original
image of adipocytes in 3D culture (A), processed image using the currently
available program (B), processed image using the new algorithm (C).
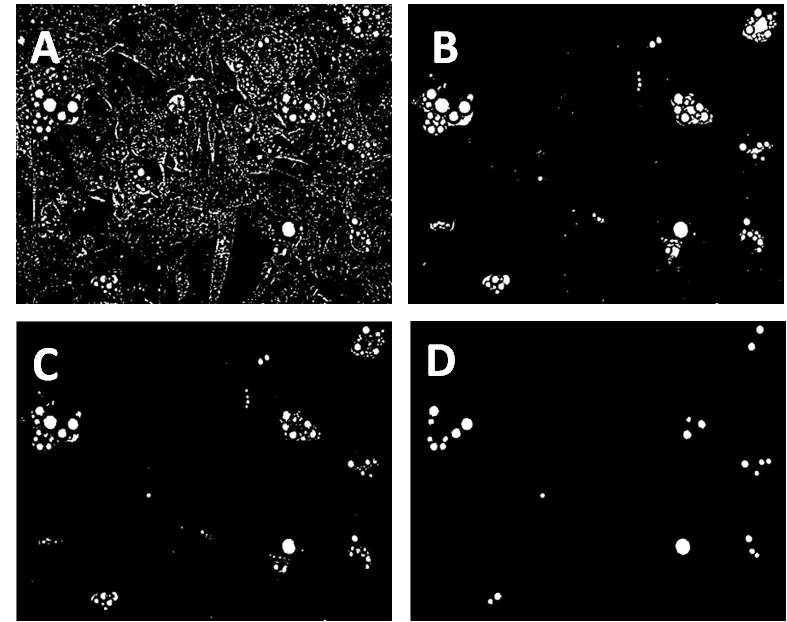
Figure 2: Image analysis algorithm. High threshold image (A), low threshold image (B), intersected image (C). Circle finding on the low threshold image (D).
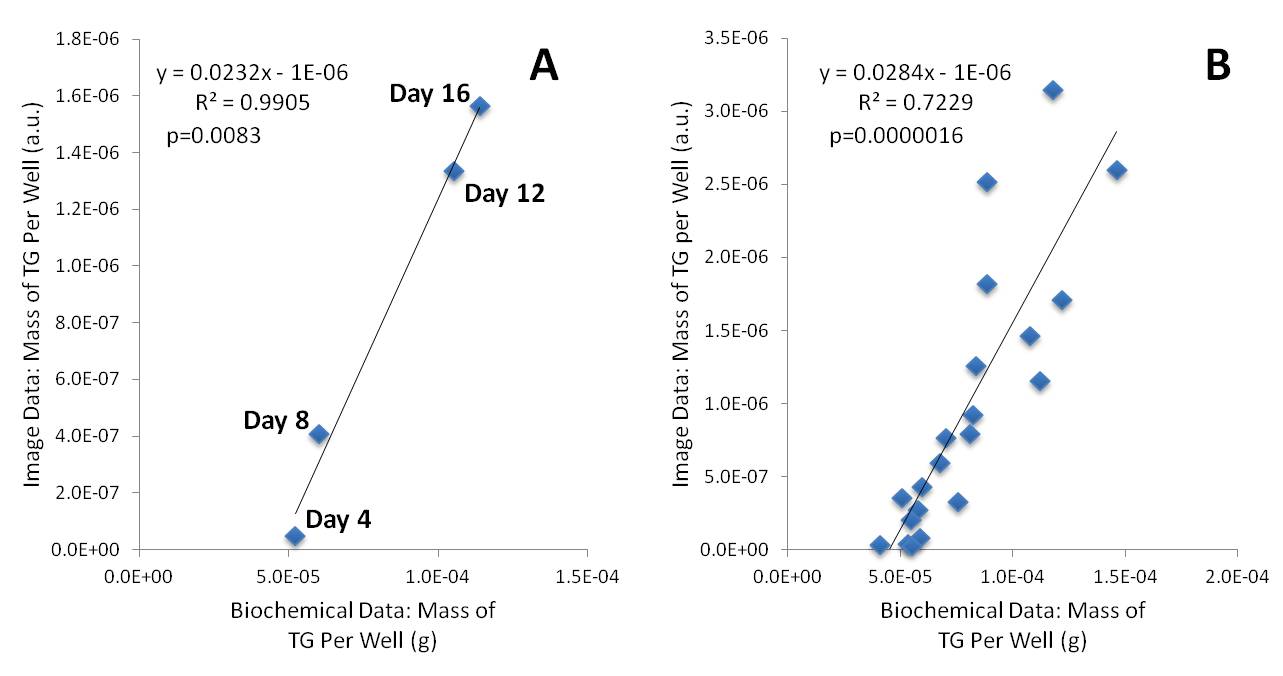 Figure 3:
Comparison of triglyceride accumulation assessed via enzymatic assay (x axis)
and image analysis (y axis). The four points represent averages of 6 wells for
day 4, day 8, day 12, and day 16. (A) Each point represents data from a single
well. (B)
See more of this Group/Topical: Food, Pharmaceutical & Bioengineering Division