
 Google
 Yelp
 Facebook
 Twitter
 ChEnected
340487 A Tomographic Study On the Effect of Liquid/Slurry Viscosity in a Slurry Bubble Column
A tomographic study on the effect of liquid/slurry viscosity in a slurry bubble column
Swapna Rabha1, Markus Schubert1, Uwe Hampel1,2
1Institute of Fluid Dynamics, Helmholtz-Zentrum Dresden-Rossendorf, Germany
2AREVA Endowed Chair of Imaging Techniques in Energy and Process Engineering, Dresden University of Technology, 01062 Dresden, Germany
1. Introduction
Slurry bubble column (SBC) reactors find a wide range of application in the chemical process, pharmaceutical and biochemical industries, etc. Over the past decades, various experimental and numerical studies have been done in an attempt to capture the impact of solids in terms of solid concentration and solid particle size on various hydrodynamic propertices1-4. However, still the knowledge about the possible effects of solids on the gas-liquid system is not understood clearly. Due to this lack of clear understanding on the influence of the solid particles, the prediction of the complex flow behavior of gas-liquid-solid flows in slurry bubble column reactor becomes very difficult. In most of numerical investigations5-6, the gas flow behaviour was predicted considering the uniform suspension of the solids in the liquid phase, i.e. the slurry phase was modeled as a single pseudo-homogeneous phase. The assumption of a pseudo-slurry phase may probably be reasonable for smaller particles where particle Reynolds number, ReP, is below 0.3 and stokes law assumption is valid. However, for larger particles, where ReP is higher than 0.3, the effect of the solid phase on the liquid cannot be neglected. Furthermore, all the available correlations for slurry viscosity7-8 consider only the effect of Cs, neglecting the effect of particle size and superficial gas velocity.
In the present work, an attempt has been made to study the effect of viscosity in two-phase (air / water + glycerol) system and compared with the apparent (slurry) mixture viscosity in three-phase (air / water +glass particles) system on the hydrodynamic parameters like gas holdup at approximately same viscosities under similar operation conditions.
2. Experimental setup & ultrafast electron beam X-ray tomography
The experimental setup consists of a cylindrical column of 70 mm inner diameter and 1500 mm height4. The details of the experimental setup are explained by Rabha et al.4. The mixture viscosity of the slurry (water + solid) was calculated from available correlations as shown in Figure 1(a). The density and size of the glass particles were 2500 kg.m-1s-1 and 100 µm, respectively. The volumetric solid concentrations considered in the present work were 0, 0.05, 0.10, 0.20 and 0.36. On the other hand, the viscosity of the viscous liquid (water + glycerol), which was almost equal to the mixture viscosity of the slurry phase considered in the present work, was measured by a viscometer and is shown in Table 1. The superficial gas velocities considered in the present work were 0.02, 0.034, 0.05, 0.1 m/s.
In-house developed ‘Ultrafast electron beam X-ray tomography' was used to produce cross-sectional slice images of the flow structure inside the slurry bubble column as shown in Figure 1(b). The details of the experimental techniques, the applied tomography image reconstruction and the applied procedure for calculating gas hold-up and approximate bubble size distribution from the tomographic images are explained in previous publications4, 9-11. For the present experimental studies, a temporal resolution of 2000 frames per second for 10 seconds of measurement was used. The scan heights considered in the present work were 300, 600 and 950 mm.
|
|
(a)
| (b)
|
Figure 1. (a) The available correlation of mixture viscosity and (b) principal of ultrafast electron beam X-ray tomography.
| |
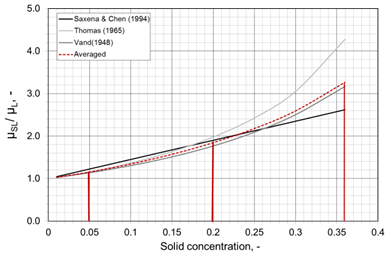
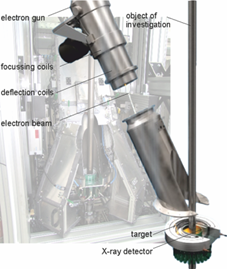
Table 1. Viscosities considered in the present work.
| ||||
Air-water+ glycerol system
| Air-water-glass particles
| |||
Glycerol (vol %) | Water (%)
| Viscosity (mPa.s)
| Glass particles concentration (wt.%)
| Viscosity (mPa.s)
|
0
| 100
| 1
| 0
| 1
|
8
| 92
| 1.33
| 5
| 1.29
|
20
| 80
| 2.15
| 20
| 1.9
|
38
| 62
| 3.93
| 36
| 4
|
3. Results and discussion
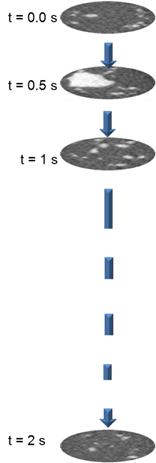
Experiments were conducted for liquid viscosities (1 ≤ µL ≤ 3.93 mPa.s) at different gas superficial velocities (0.02 ≤ UG ≤ 0.1 m/s) at different scan heights (H = 300, 600, 950 mm). The evolving 3D gas phase flow structures were visualized from a stack of 4000 reconstructed cross-sectional tomographic images captured in 2 seconds (Figure 2). The vertical coordinate of these virtual projections is the time. The time averaged radial gas holdup was calculated from 20000 tomographic captured in 10 seconds based on the grey level values.
3.1 Gas phase flow structure
The effect of viscosity (1 ≤ µL ≤ 3.93 mPa.s) on the gas phase flow structure for the two-phase (gas air / water + glycerol) system at UG = 0.02 m/s and height H = 300 mm is shown in Figure 2 (a). The gas phase flow structures at different solid loading (Cs = 0.05, 0.20, 0.36) which correspond to slurry viscosities of 1 ≤ µm ≤ 4 mPa.s at UG = 0.02 m/s and height H = 300 mm are shown in Figure 2(b).
With the increase of liquid viscosity, formation of large bubbles was observed due to bubble coalescence. However, the effect of apparent slurry viscosity on the bubble coalescence was more significant as compared to that of liquid viscosities (Figure 2)
|
|
|
|
|
|
|
|
|
|
|
µL/µM (mPa.s)
|
| 1
|
| 1.33
| 2.15
| 3.93
|
| 1.29
| 1.9
| 4
|
|
| (a) Two-phase system
|
| (b) Three-phase system
| ||||||
Figure 2. Gas phase flow structure for two-phase and three-phase system at UG = 0.02 m/s and height H = 300 mm.
| ||||||||||







3.2 Radial gas holdup
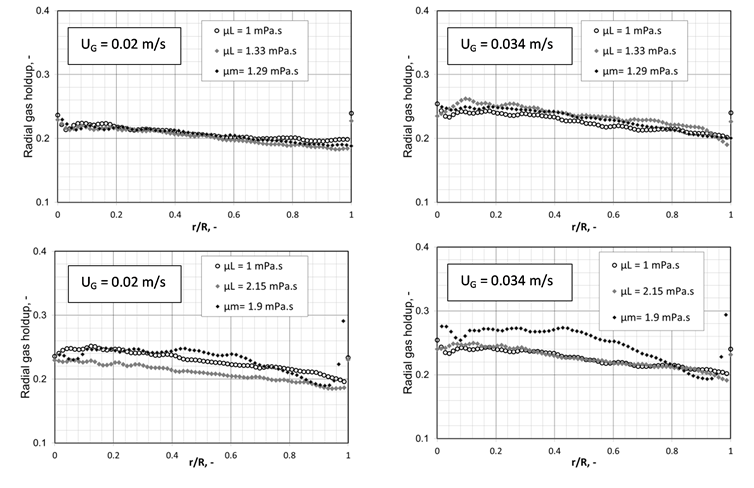
The time-averaged radial gas holdup profiles for the air / water + glycerol system (1 ≤ µL ≤ 3.93 mPa.s) at gas superficial velocity, UG = 0.02 & 0.034 m/s and scan height H = 300 mm are plotted in Figure 3. The time-averaged radial gas holdup profiles for air / water+ glass particles at mixture viscosity, µm = 1.29 and 2.15 mPa.s which corresponds to solid concentration Cs = 0.05, 0.20 are also shown in Figure 3.
The effect of liquid & slurry viscosity on the time-averaged radial gas holdup profile for both two-phase and three-phase system were insignificant at lower viscosities (µL = 1.33 and µm = 1.29 mPa.s). However, at higher viscosity, the effect of slurry viscosity on the time-averaged radial gas holdup was more pronounced as compared to that of the liquid viscosity, which could be due to the interaction of the solid and the gas phase.
4. Summary
Experimental investigations were done for both two-phase and three-phase system to study the effect of liquid viscosities (1 ≤ µL ≤ 3.92 mPa.s) and slurry viscosities (1 ≤ µm ≤ 4 mPa.s) on the hydrodynamic parameters. The effect of slurry viscosity on the gas holdup was significantly different than that of liquid viscosity at higher viscosities which clearly shows the interaction of the particles on the gas phase. The detailed results of the effect of viscosity (1 ≤ µm ≤ 4 mPa.s) on gas holdup and bubble size distribution for both two phase and three phase system at different superficial gas velocities (0.02 -0.1 m/s) and liquid heights (300 – 950 mm) will be discussed in the full length manuscript.
|
Figure 3. Time averaged radial gas holdup for 1 ≤ µL ≤ 3.93 mPa.s and 1 ≤ µm ≤ 4 mPa.s) at UG = 0.02 & 0.034 m/s and H = 300 mm.
|
Reference
[1] Kara S, Kelkar B.G., Shah Y., Carr N.L., Hydrodynamics and axial mixing in a three phase bubble column. Ind. Eng. Chem. Proc. Des. Dev. 1982; 21:584-594.
[2] Krishna R, De Swart J.W.A., Ellenberger J, Martina G.B., Maretto C., Gas holdup in slurry bubble columns: effect of column diameter and slurry concentrations, AIChE J. 1997;43(2):311-316.
[3] Mena P.C., Ruzicka M.C., Rocha F.A., Teixeira J.A., Drahos J., Effect of solids on homogeneous heterogeneous flow regime transition in bubble columns. Chem Eng Sci. 2005; 60(22):6013-6026.
[4] Rabha, S. S., Schubert, M., Wagner, M., Lucas, D., Hampel, U., Bubble size and radial gas hold-up distributions in a slurry bubble column using ultrafast electron beam X-ray tomography, A.I.Ch.E. J. 2013; 59 (5), 1709-1722.
[5] Troshko, A., Zdravistch, F., CFD modeling of slurry bubble column reactors for Fisher–Tropsch synthesis, Chem. Eng. Sci. 2009; 64, 892-903.
[6] Michele, V., Hempel, D.C, Liquid flow and phase holdup measurement and CFD modeling for two-and three-phase bubble columns. Chem. Eng. Sci. 2002; 57. 1899-1908.
[7] Saxena, S.C., Rao, N.S., Saxena, A.C., Heat transfer from a cylindrical probe immersed in a three-phase slurry bubble column. Chem. Eng. J. 1990; 44, 141-156.
[8] Vand, V., Viscosity of solutions and suspensions I. Theory. Journal of Physical Chemistry 1948; 52, 277-299.
[9] Fischer F, Hoppe D, Schleicher E, Mattausch G, Flaske H, Bartel R, Hampel U. An ultra-fast electron beam x-ray tomography scanner, Meas. Sci. Technol. 2008; 19: 094002.
[10] Fischer F, Hampel U. Ultra-fast electron beam x-ray computed tomography for two-phase flow measurement, Nucl. Eng Des. 2010; 240(9):2254-2259.
[11] Prasser H-M, Scholz D, Zippe C, Bubble size measurement using wire-mesh sensors. Flow Meas. Instrum. 2001; 12/4:299-312.
See more of this Group/Topical: Catalysis and Reaction Engineering Division