
 Google
 Yelp
 Facebook
 Twitter
 ChEnected
342569 Information Thermodynamics and Bayesian Optimization: Applications to Single Molecule Experiments
We present a fundamental analysis of the information content for dynamics trajectories that is applicable to all systems governed by over-damped Langevin dynamics. The Fisher information metric for this class of time propagators is presented and the trajectory entropy functional is derived. This subsequently permits evaluation of the magnitude of descriptive features in the dynamic model parameterized by the potential of mean force and diffusion coefficient along a characteristic system coordinate(s).
Armed with a measure of "entropy" for a systems equilibrium trajectories, we are able to define a new manifold of information thermodynamics to balance the inputs of "internal energy" or log-likelihood statistical information from simulation and experiment with the desire to generate the simplest models of system behavior that contain only statistically significant features. This formulation permits the derivation of the least informative dynamic models subject to kinetic constraints such as mean-first passage times. Finally, we provide specific examples from performing Bayesian optimization of model parameters from single-molecule FRET experiments. Exploring what is the equivalent of a phase diagram for the operation of inverse mapping of data to models, allows for an optimal choice of regularizing parameters for model selection.
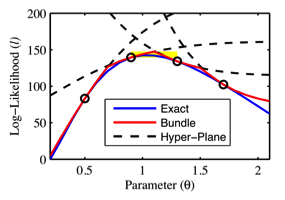
Figure 1. Functional approximation of the log-likelihood surface for a multi-dimensional parameter set θ which is a composite of the potential of mean force V(x) and the diffusion constant D. The dotted lines are hyper-planes in the functional space generated by projecting derivatives of the log-likelihood. Red lines are the convex hull created by the set of these upper bounds, and blue line is the true experimental/simulation likelihood as a parameterized by θ.
See more of this Group/Topical: Computational Molecular Science and Engineering Forum