
 Google
 Yelp
 Facebook
 Twitter
 ChEnected
344308 Selectivity of the Fischer-Tropsch Process: Deviations From Single Alpha Product Distribution Explained By Gradients in Process Conditions
The Fischer-Tropsch (FT) process, which converts syngas to hydrocarbons, is a key conversion step in one of the most important routes to alternative fuel. Various models exist for the selectivity of this reaction. The simplest and most widely used is the Anderson-Schulz-Flory (ASF) model, where the FT reaction is modeled as an addition polymerization reaction with chain growth probability α. The resulting product distribution, depicted as a plot of the logarithmic molar fraction versus the carbon number, is a straight line. However, deviations from this ASF product distribution are regularly observed.
In this study, an explanation is given for the positive deviations from ASF product distributions. This explanation is based on a variable-α model that takes into account the local reactor temperature and syngas ratio [1]. Using this model, we aim to demonstrate that gradients in process conditions can result in gradients in the chain growth probability α and apparent non-ASF distributions.
Gradients in process conditions can take place on the micro-scale due to diffusion limitations in the catalyst particle, as well as on the meso-scale, e.g. due to heat transfer limitations in a packed bed reactor. These two situations were modeled, applying a process-condition-dependent α-model [1]. In the first case, a reaction-diffusion model for a spherical catalyst particle was applied. In the second case, a temperature gradient was imposed in a simple 1-D reactor model. The product distribution was calculated in two different ways: using the average chain growth probability, and by summating local product distributions weighed with the reaction rate and incremental volume.
In strongly diffusion-limited systems, a significant difference between these two distributions was found. The use of the average α gives a straight distribution with a C5+ selectivity of 8.1%, while the weighted summation of local distributions gives a curved plot with a positive deviation in the higher carbon numbers and a C5+ selectivity of 32% (see Figure 1).
The cause of this effect is the occurrence of gradients in the local syngas ratio in the catalyst particle due to diffusion limitations. Towards the inside of the particle, CO becomes depleted, causing an increasing H2/CO ratio and a decreasing α. The prominence of this effect depends strongly on the diffusion length, temperature, syngas ratio and catalyst activity. At H2/CO = 2, a popular choice for experimental conditions since it is close to the overall stoichiometric consumption of the reactants, even catalyst particles as small as 200 μm are easily CO depleted.
On the meso-scale, an imposed temperature gradient of 30˚C led to similar α-gradients and curved product distributions.
We conclude that curved (non-ASF) product distributions can occur when there is a gradient in process conditions leading to a gradient in the chain growth probability α. The origin of this effect can take place on the micro-scale, i.e. concentration gradients caused by diffusion limitations in the catalyst particles, or on the meso-scale, i.e. gradients in local conditions such as temperature. When such gradients are modeled, the selectivity should be calculated by weighted summation of local product distributions.
[1] Vervloet, D., Kapteijn, F., Nijenhuis, J., van Ommen, J.R., Fischer-Tropsch reaction-diffusion in a cobalt catalyst particle: aspects of activity and selectivity for a variable chain growth probability. Catalysis Science & Technology, 2012. 2(6): p. 1221-1233.
[2] Kruit, K.D., Vervloet, D., Kapteijn, F., van Ommen, J.R., Selectivity of the Fischer-Tropsch process: Deviations from single alpha product distribution explained by gradients in process conditions. Catalysis Science & Technology, 2013. DOI:10.1039/C3CY00080J
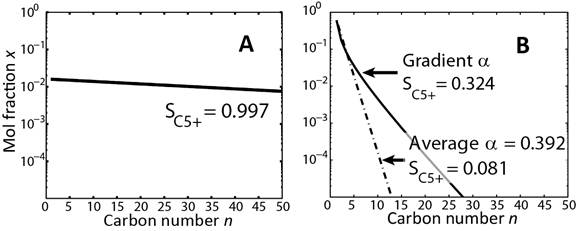
Figure 1. FTS product distribution results of reaction-diffusion model for 2 example cases, calculated using the average α as well as the weighted sum of product distributions from a gradient α: (A) T=180˚C, dcat=1mm, H2/CO=2, FYS=2. Both curves completely overlap. (B) T=230˚C, dcat=1mm, H2/CO=2, FYS=2.
See more of this Group/Topical: Catalysis and Reaction Engineering Division