
 Google
 Yelp
 Facebook
 Twitter
 ChEnected
347550 Shape Memory Polymer Nanofoams
Shape Memory Polymer Nanofoams
L. Smith1, A.P. Soliani2, I. Luzinov2
1 Biomedical, Chemical, and Materials Engineering, San Jose State University, 95192
2 Department of Materials Science and Engineering, Clemson University, 29634
The purpose of the current research is to investigate the effects of cross-linking on the formation and response of a shape memory nanofoam polymer material. The evaluation has been conducted through a foaming process and the response of said material to various analytes. In essence, the project investigates different polymers with various chemical functionalities and different number of available epoxy groups to create a specific and selective shape memory material that will be able to sense (“respond”) in a unique way to various analytes. The shape memory behavior of the system will be imparted by nature of the anchoring layers containing different amounts of reactive epoxy groups.
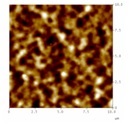
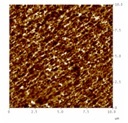
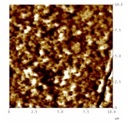
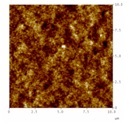
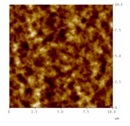
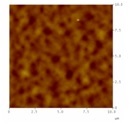
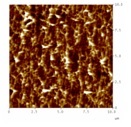
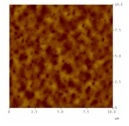
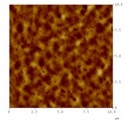
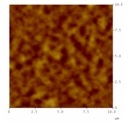
The investigated anchoring layers were poly (glycidyl methacrylate) (PGMA) and a random copolymer composed of 70:30 poly(methyl methacrylate) (PMMA) and PGMA, respectively. The anchoring layer was further functionalized with low molecular weight carboxy- terminated polystyrene (PS) by grafting. The polymer was deposited via dip-coating technique and annealed at five temperatures to achieve different PS thicknesses grafted to the anchoring layer. To monitor the changes in thickness and morphology of the system, reflectometry and atomic force microscope (AFM) were used. Initial results indicate that the layers were successfully synthesized, foamed, and showed a specific and different response when exposed to a number of analytes in a sequential manner. The table tracks the thickness through the process and the figure demonstrates what is happening on nanometer level.
Table: Thickness measurements of samples annealed at 900C. Thickness in nm.
| PS layer | Foam layer | Acetone | Toluene | Chloroform |
PGMA-PMMA | 99.4 | 112.7 | 111.9 | 110.7 | 109.1 |
PGMA | 52.6 | 62.9 | 54.7 | 53.6 | 53.9 |
|
|
|
See more of this Group/Topical: Student Poster Sessions