[1] Bi, H.T. (2007). Chem. Eng. Sci., 62, 3473-3493.
[2] Fan, L.T.,
Ho, T., Hiraoka, S. and Walawender,
W.P. (1981). AIChE J., 27, 388-396.
[3] Littman, H.
and Homolka, G. (1973). Chem. Eng. Sci., 28, 2231-2243.
[4] Müller,
C.R., Davidson, J.F., Dennis, J.S., Fennell, P.F., Gladden, L.F., Hayhurst, A.N., Mantle, M.D., Rees, A.C., Sederman, A.J. (2007). Powder Technol., 177, 87-98.
[5] Boyce, C.M., Holland, D.J., Scott, S.A., Dennis,
J.S. (submitted 2013). Phys. Rev. E.
Figures:
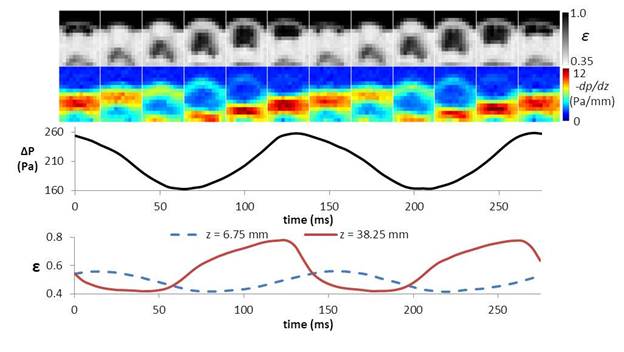 Figure 1.
Analysis of pressure oscillations in a fluidized bed with H0 = 40 mm and Dbed = 50 mm. Over 275 ms
this figure gives: voidage maps (first row) and
differential pressure drop in the vertical direction maps (second row) every 25
ms, as well as traces of pressure drop across the
entire bed (third row) and 1-D voidage at the top and
bottom of the bed (fourth row).
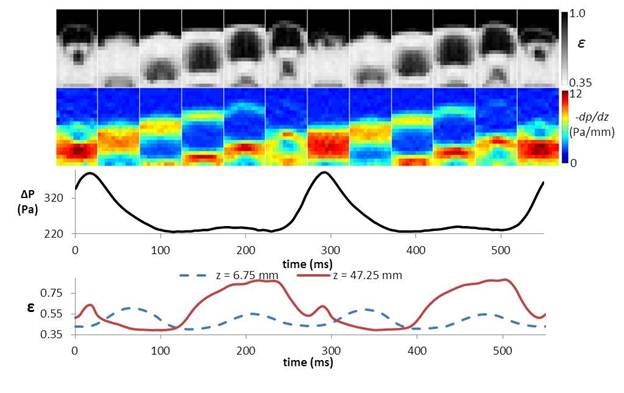 Figure 2.
Analysis of pressure oscillations in a fluidized bed with H0 = 50 mm and Dbed = 50 mm. Over 550 ms
this figure gives: voidage maps (first row) and
differential pressure drop in the vertical direction maps (second row) every 50
ms, as well as traces of pressure drop across the
entire bed (third row) and 1-D voidage at the top and
bottom of the bed (fourth row).
Tables:
Table 1. Frequencies of bubble
formation (fform),
bubble eruption (ferupt)
and oscillations in pressure drop (fΔP), as well as the ratio of effective
bubble diameter to bed diameter (De/Dbed) in a 50 mm diameter bubbling fluidized
bed with varying tapped bed heights (H0).
The results are given for a DEM-CFD model as compared to experiments [4] using
a combination of magnetic resonance (MR) imaging and a pressure sensor.
| | DEM-CFD Results | Experimental Results |
| H0 (mm) | fform (Hz) | ferupt (Hz) | fΔP (Hz) | De/Dbed | ferupt (Hz) | fΔP (Hz) |
| 30 | 6.96 | 6.96 | 6.96 | 0.41 | 6.4 | 6.0 |
| 40 | 7.12 | 7.14 | 7.15 | 0.44 | 5.6 | 5.5 |
| 50 | 7.42 | 3.73 | 3.72 | 0.66 | 2.9 | 3.0 |
| 60 | 7.57 | 3.75 | 3.79 | 0.65 | 2.9 | 3.1 |

 Google
 Yelp
 Facebook
 Twitter
 ChEnected