
 Google
 Yelp
 Facebook
 Twitter
 ChEnected
455234 Microcrystalline Cellulose – Does Wood Pulp Source Impact the Direct Compression Performace of This Excipient?
INTRODUCTION
In a quality by design (QbD) environment knowledge and understanding of raw material critical quality attributes (CQAs) are essential [1]. Excipient variability is an important consideration particularly when blended with challenging APIs where manufacturing may occur close to the edge of failure, i.e. close to the acceptance limits for critical quality attributes. In such cases small variations in an excipients attribute could possibly impact the end product quality, even if the variation is within the excipient’s certificate of analysis release specifications. Continuous process improvement, continuous manufacturing and regulatory requirements for improved process understanding as covered by ICH Q10 [2] drive a need to understand the impact of excipient variability on finished product performance.
Microcrystalline cellulose (MCC) was chosen as the excipient of study due to its widespread use as a diluent/filler or binder in solid oral dosage form manufacturing. MCC has been available as a pharmaceutical excipient since 1964 [3] and consequently there has been much previous research into its material attributes. Moisture [4], crystallinity [5-7], degree of polymerisation (DP) [3], surface area and porosity [4] have been suggested in the literature as material attributes for consideration when processing MCC.
In order to understand the possible variability in MCC it is important to understand its manufacturing process. Pharmaceutical cellulose is derived from wood pulp. Trees are broken down into wood chips which undergo a chemical process known as the ‘Kraft process’[8] which removes the lignin that links cellulose chains together as wood. Wood pulp is the starting material bought by MCC manufacturers. The type of wood source (soft/hard woods) will affect the chemical content (the hemicellulose content and crystallinity) of the wood pulp.
MCC manufacturers treat the wood pulp with acid to breakdown the long cellulose chains into smaller chain lengths (reduce the degree of polymerization). Acid hydrolysis cleaves the long cellulose chains at amorphous sites where hemicellulose sugar chain branches are located. Therefore how the cellulose is hydrolysed is dependent on its chemical content and the number of amorphous regions. The length of the hydrolysis time and final DP of a batch of MCC is influenced by the wood pulp type as different wood pulps have characteristic leveling off degrees of polymerization e.g. 180-210 for hard woods and 210-250 for soft woods [3]. By blending different wood pulps together before hydrolysis the DP can be predicted by manufactures. This is an important control as it can influence the MCC final bulk density[3]. The resulting shorter cellulose chains are thus more crystalline as the amorphous regions have been cleaved, hence the name microcrystalline cellulose. Post hydrolysis steps (spray drying/air stream drying and sieving) offer manufactures the opportunity to manipulate the final lot bulk density, PSD and mean particle size to produce product within specification.
The study presented aims to understand if samples of MCC grade PH102 produced from different wood pulp mixes show differences in physicochemical properties and hence compaction performance during a direct compression process.
<>Materials and Methods
Three batches of MCC PH102 produced from a range of pulp sources were supplied by FMC. The pulp types have not been disclosed due to commercial sensitivity. All samples were produced using the commercial scale process and meet with supplier and pharmacopeia specifications.
· Sample 1 - 75% Pulp X: 25% Pulp Y
· Sample 2 - 50% Pulp X: 50% Pulp Z
· Sample 3 - 100% Pulp X
MCC PH102 lots
were characterized and compared for differences in particle size distribution
(sieve analysis), moisture content (thermogravimetric analysis), crystallinity
(FTIR) and surface area (BET N2 adsorption), degree of
polymerization and scanning electron microscopy.
RESULTS
AND DISCUSSION The particle
size distribution (PSD) profiles of each sample as received did indicate a
significant difference in PSD particularly the % fines. The sieved size
fraction (106-250 μm) of each sample was then compared in order to
eliminate the influence of PSD and % fines as a possible reason for differences
in the compressibility of the lots.
Characterization
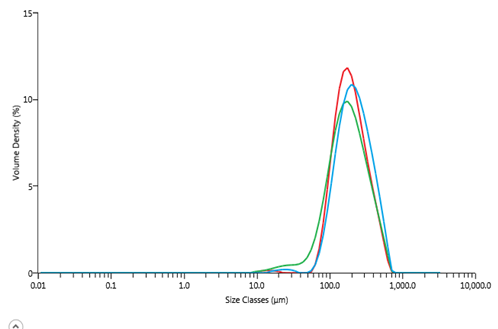
of the 106-250 μm size fractions for each sample identified differences in the surface
area, crystallinity and bulk density (Table 1) and the PSD (Figure 1). All lots
had a moisture content determined by loss on drying in the range 3.74 - 4.86%
w/w. It was assumed that within this range moisture was not an influencing
factor [4].
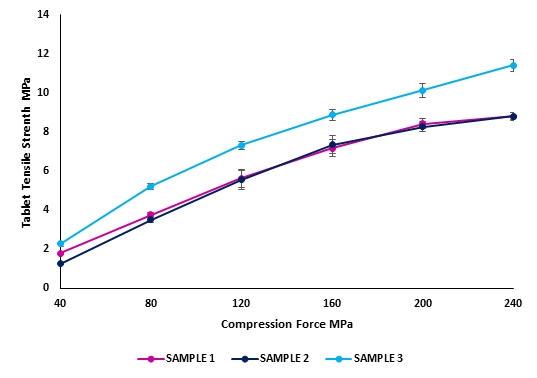
When comparing compression
profiles of samples (Figure 2), Samples 1 and 2 which were
manufactured from pulp mixes were similar. However Sample 3, manufactured form
100% of pulp X, showed a significantly higher compressibility.
The study
results show that particle size is a major factor that influences MCC
compressibility. Following correction for particle size, Sample 3 produced from
a single pulp source showed superior compression properties. The particle
properties resulting in this increase in compaction are currently inconclusive
and being explored. Further studies will focus on degree of polymerization and
particle mechanical parameters during compression.
CONCLUSIONS Previous studies
[9, 10] have discussed wood pulp as a source of variability between batches
of MCC. Mixing wood pulps minimizes this variability. In this study a MCC
sample produced from 100% of one particular wood pulp during manufacture of MCC
produced material which performed differently during direct compression
compared to samples from pulp mixes when corrected for difference in particle
size between samples.
The impact of
this variability in MCC will be formulation specific. It is envisaged for
blends with a high % API loading which is difficult to compact, this
variability may be significant to drug product manufacturers. This also
highlights the importance of using a number of different lots of excipients
during drug development to capture excipient variation where it is potentially
a risk factor.
ACKNOWLEDGMENTS This research is funded by the Synthesis
and Solid State Pharmaceutical Centre (SSPC) and Science Foundation Ireland
(SFI) under grant number 12/RC/2275. PH102 was donated by FMC Corporation.
REFERENCES Table 1.
Characterization results of the 106-250 μm size fraction for each of the three samples before compression.
SAMPLE 1 SAMPLE 2 SAMPLE 3 Moisture %w/w 4.41 ± 0.68 4.86 ± 0.64 3.74 ± 0.36 Bulk density g/cm3 0.32 0.32 0.34 IR Crystallinity (Nelson et al 1964, ) 0.86 0.90 0.94 Surface Area m2/g 1.232 1.148 1.289 D50 μm 174 ± 0.00 212 ± 3.46 186 ± 1.53 Figure 1.
Malvern PSD of 106-250 μm size fraction comparison for the three samples. Sample 1 (green),
sample 2 (blue) and sample 3 (red).
Figure 2. Compression
profiles for the three samples. Tensile strength for N=20 tablets
See more of this Group/Topical: Pharmaceutical Discovery, Development and Manufacturing Forum