
3D Raman Imaging: A Method to Study the Effects of Lubrication on the Microstructure of Tablets
Shashwat Gupta, Savitha Panikar, Fernando Muzzio
Rutgers- The State University of New Jersey
When it comes to pharmaceutical tablets, there are known knowledge gaps in the current manufacturing processes, particularly regarding the relationship between material properties of ingredients, processing conditions, and resulting tablet attributes. These three aspects can be linked through a common feature of understanding the microstructure of a sample. A better understanding of tablet microstructure has the potential to unlock the black box between process parameters and performance attributes. Product structure understanding of this nature can aid in prediction of product performance, process development as well as deviation investigations. Understanding the microstructure of a tablet requires knowing the spatial distribution of the different ingredients and void space, which can be enabled by Chemical Imaging (CI).
Raman imaging is a powerful tool for studying tablet structure, with superior chemical specificity than NIR and is also less affected by physical characteristics of the sample.
This study focuses on using 3D Raman Imaging system (H2Optx), as an off-line measurement system, to bridge this gap for tablets made using a Direct Compression (DC) continuous line, for the lubrication process. For pharmaceutical operations, lubrication is essential in order to reduce the friction between the surfaces of manufacturing equipment and that of organic solids as well as to ensure the continuation of an operation. The most common pharmaceutical lubricant used is Magnesium Stearate (MgSt). Till now, extensive structural studies have not been conducted to study the effects of lubricant(s) on tablet properties.
In this work, we investigate the particle size distribution, spatial variability (Variograms) of MgSt, using the 3D Raman Images. These parameters are then correlated with product performance (tablet hardness and dissolution profile) as well as formulation (amount of MgSt) and process parameters (Total exposure to shear and Residence Time), with the help of Principle Component Analysis.
Variographic data helped to quantify the distribution of MgSt in tablets of experimental conditions. On the other hand, to discern the variability in the distribution of MgSt within the layers of a tablet, we needed PCA score plots of the variographic data obtained from the 3D Raman images. They revealed a stark difference in the clustering of the layers for the tablets with different process and formulation parameters. The hardness of the tablets from the two experimental conditions agree with the expected trend. A wider distribution of MgSt resulted in tablets with a lower tablet hardness. However, there is not a clear trend in the dissolution profile with respect to the distribution of MgSt.
An example of a comparison between 3D Raman Images of tablets elucidating the effect of total exposure to shear is shown below:
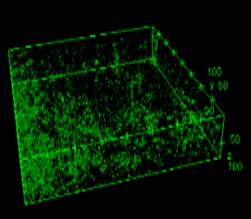
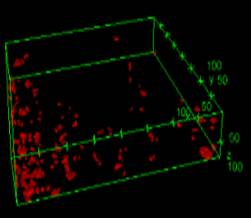
(a)
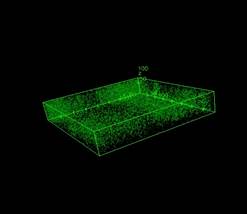
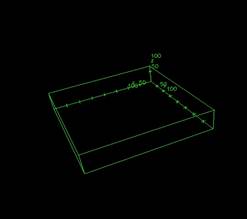
(b)
Figure 1: 3D Raman Images (a) Lower exposure to shear: MgSt, green – particles <50 microns, red – particles from 50 to 250 microns and (b) Higher exposure to shear: MgSt, green – particles <50 microns, red – particles from 50 to 250 microns
The future research will involve studying how the distribution of MgSt changes in a tablet, as we move ahead in a continuous line i.e. comparison between post blending and post tableting samples. All the work will be used as a platform for an on-line measurement system.
See more of this Group/Topical: Pharmaceutical Discovery, Development and Manufacturing Forum