
Introduction
The drag coefficient of bubble swarms is different from that of single bubbles for the existence of the bubble interaction [1-3]. Some researchers [3-4] studied the rising of bubbles in bubbly flow and found that the velocity of small bubbles decreased in the bubble swarms due to hindering effect. Meanwhile, some other researchers [5-6] found the rising velocity of large bubbles increased due to wake accelerating effect. To account for these effects, some correlations were proposed for the relatively velocity or drag coefficient of bubble swarms. Actually, both the hindering effect of small bubbles and wake accelerating effect of large bubbles exist in bubble swarms [1-2], and the drag coefficient should be related to both the bubble diameter and local gas holdup. However, the applicable condition range of the existing drag models and correlations are still limited. The present work aimed to propose a drag model applicable in a wider range of conditions by correlating with the bubble size distribution and local gas holdup and including both the hindering effect and wake accelerating effect. The performance of this drag model was investigated in the numerical simulations of a bubble column with a CFD-PBM (population balance model) coupled model.
Model Development
The numerical simulations were carried out with the CFD-PBM coupled model, which was similar to that used in our previous work [7], except that a new drag model was employed, as shown in Figure 1. The average drag coefficient of single bubbles was first calculated based on the local gas holdup and bubble size distribution. Then the lumped quantity of bubble swarms effect was modified with a drag correction factor CD/CD0, which based on the bubble size distribution and local gas holdup and included both hindering effect of small bubbles and wake accelerating effect of large bubbles in bubble swarms.
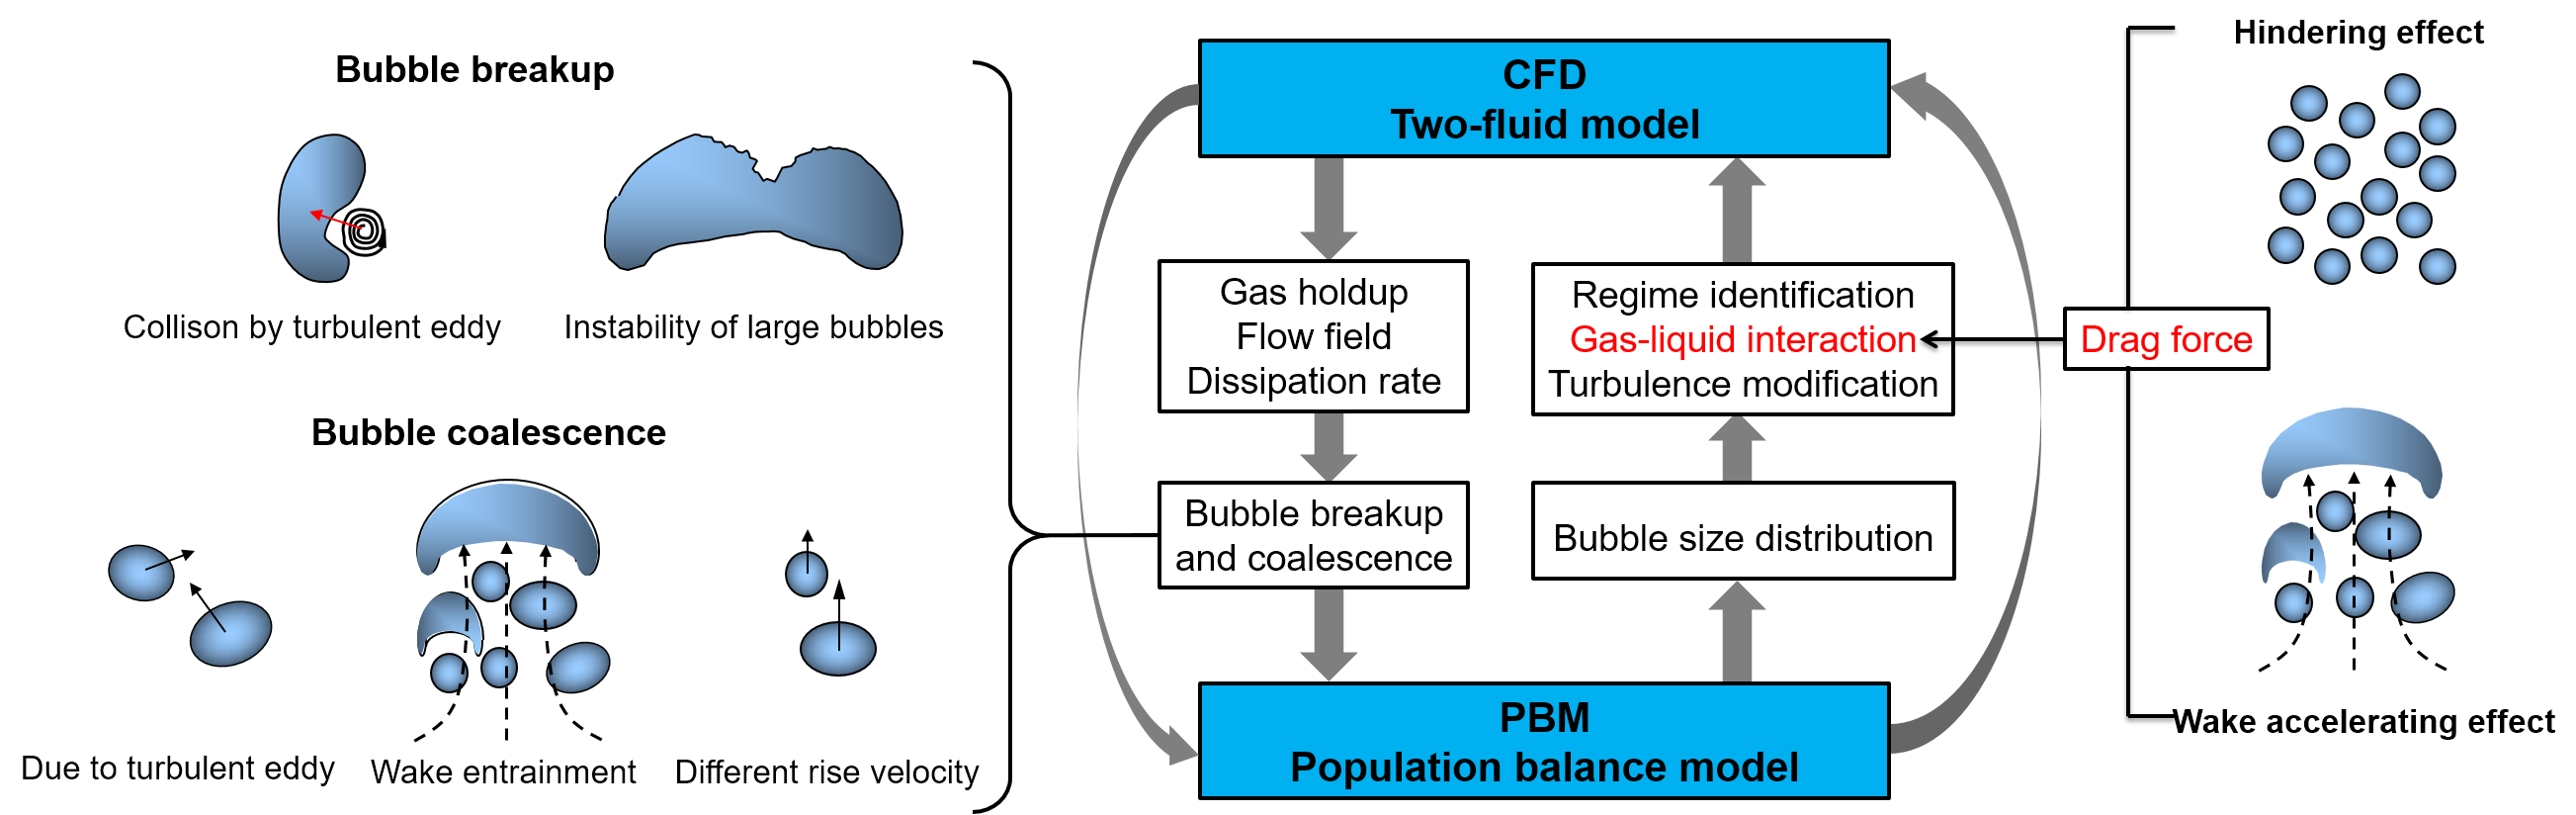
Figure 1. Schematic of the CFD-PBM coupled model with drag force of bubble swarms.
Results and Discussion
The calculated drag correction factor was plotted as a function of the local gas holdup for different superficial gas velocities, as shown in Figure 2(a). With increasing local gas holdup, CD/CD0 increased linearly in the low gas holdup range, then increased to its maximum (1.5 at 0.06 m/s), and significantly decreased in the high gas holdup range. This complex variation was attributed to the change of the governing factor from the hindering effect of small bubbles to the wake accelerating effect of large bubbles. Although the variation trend for the drag correction factor was similar at different superficial gas velocities, the value of CD/CD0 depended on the gas velocity, especially at low local gas holdup. The reason was that the drag correction factor depended not only the local gas holdup, but also the bubble size distribution that can be significantly different even at a certain local gas holdup.
To provide a concise diagram, we chose the simulated data of Ug = 0.06 m/s to compare with the experimental results from literatures [2-3]. Note that the data of Roghair et al. [3] were from numerical experiments for db = 4 mm. The complex variation trend of CD/CD0 was similar, as shown in Figure 2(b). The slight deviation was attributed to the different bubble size distributions.
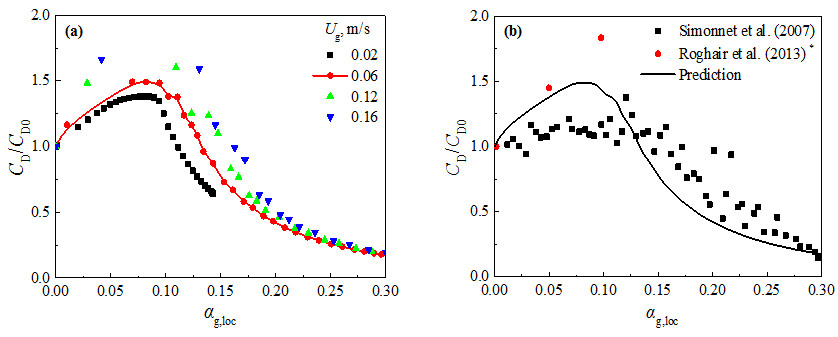
Figure 2. (a) Simulated drag correction factors at different superficial gas velocities; (b) Comparison of simulated and experimental drag correction factors.
Conclusions
Both the hindering effect and wake accelerating effect exist for bubble swarms in a bubble column. With increasing local gas holdup, the drag correction factor increased and then decreased, which was attributed to the change in the governing factor from the hindering effect of small bubbles to the wake accelerating effect of large bubbles. The drag model based on the bubble size distribution and local gas holdup was applicable to a wider range of conditions.
Acknowledgement
The authors thank the financial supports by the National Natural Science Foundation of China (No. 21476122).
References
[1] Ishii, M., Zuber, N. AIChE J. 1979, 25: 843-855.
[2] Simonnet, M., Gentric, C., Olmos, E., Midoux, N. Chem. Eng. Sci. 2007, 62: 858-866.
[3] Roghair, I., Annaland, M.V.S., Kuipers, H.J.A.M. AIChE J. 2013, 59: 1791-1800.
[4] Lane, C.D., Parisien, V., Macchi, A., Donaldson, A.A. Chem. Eng. Sci. 2016. 152: 381-391.
[5] Thakre, S.S., Joshi, J.B. Chem. Eng. Sci. 1999. 54: 5055-5060.
[6] Krishna, R., Urseanu, M.I., Baten, J.M.V., Ellenberger, J. Chem. Eng. Sci. 1999. 54: 171-183.
[7] Wang, T., Wang, J., Jin, Y. AIChE J. 2006. 52: 125-140.
See more of this Group/Topical: Catalysis and Reaction Engineering Division