
Modeling of Structural Defects in MFI Zeolite Memabranes
Sungwon Hong1, Dongjae Kim2, Jaewook Nam2 and Jungkyu Choi1*
1 Department of Chemical & Biological Engineering, Korea University, Seoul 02841, Republic of Korea
2 School of Chemical Engineering, Sungkyunkwan University, Seoul 02841, Republic of Korea
hsw1110@korea.ac.kr, ssdj91@skku.edu, jaewooknam@skku.edu, jungkyu_choi@korea.ac.kr*
Introduction
Defects of zeolite membranes often lower their separation performance. Thus, the investigation of the defects is highly critical in achieving high separation performance. While general characterization methods (e.g. scanning electron microscopy; SEM) that examine the membrane surface cannot detect defects, the FCOM measurement is able to identify the defective structure inside the zeolite membrane using dye molecules of appropriate size [1]. In this work, various dyeing conditions (times and concentrations) were applied to a MFI zeolite membrane in an attempt to investigate the defective structure. Furthermore, the quantitative analysis is practiced to measure the defects in numerical form.
Experimental
A MFI membrane was synthesized on an ¥á-alumina disc support by employing hydrothermal growth of MFI seed layers. Then, zeolite membranes were calcined to remove organic templates in the zeolite pores. Calcined MFI membranes were further contacted with a dye molecule (~ 1 mM aqueous fluorescein). The size of fluorescein molecules (~0.9 nm) is smaller than that of intercrystalline microporous defects (~1-2 nm), but larger than that of zeolitic pores (0.5~0.6 nm). This size difference allows for the selective dyeing of defects in membranes. The dyed membranes were measured with Carl Zeiss LSM 700 confocal microscope in 488 nm wavelength. Quantitative analysis of the measured data was followed, investigating the bright sections in the FCOM images.
Results and discussion
The result images of FCOM analysis with different dyeing times are shown in Fig 1. From Fig. 1a, the appearance of bright broad lines is observed. At the same time, a number of isolated bright spots shown in Fig. 1a were pronounced in Fig. 1b and they were interconnected with the increased dye time (Fig. 1c). The dye molecules seem to prefer to access larger defects (here, crack) first and then approach smaller defects (here, grain-boundary). Interestingly, the black broad line, which was bright in both Fig. 1a and 1b, results from a quenching phenomenon, which happens when the dye molecules are stacked up and concentrated. Considering this phenomenon, crack defects could be selectively extracted among the grain-boundary defects for quantitative analysis. FCOM characterizations with different dye concentrations showed a similar trend to those with the variation in the dyeing time. Using these data, each of the defects (grain-boundary and crack) was quantified analyzed.
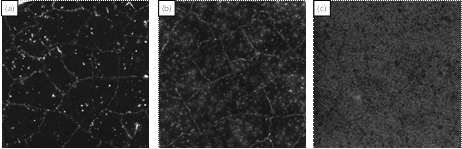
Fig. 1. FCOM images of MFI membranes, which were contacted with the dye solution in various times. (Fig. 1a is the shortest time condition and Fig. 1c is the longest time condition.)
Conclusions
FCOM measurement of zeolite membranes is a simple and effective technique to observe the defects in zeolite membranes. The experiments using FCOM measurement were performed systematically to elucidate the dyeing mechanism, and accordingly, the properties of the defects. In addition, a quantitative analysis was conducted to show the amount of the defects in MFI membranes, which can be associated with the corresponding separation performance.
References
[1] G. Bonila et al., J. Membr. Sci. 182 (2001), 103-109
See more of this Group/Topical: Separations Division