
Statistical Distribution of Microparticle Trapping in Hydrodynamic Tweezer Arrays for Single-Cells Analysis
Valerie H. Lieu, Jordan Crawford, and Daniel T. Schwartz
Department of Chemical Engineering, University of Washington, Seattle, USA
Abstract
Steady streaming microeddies can be useful for trapping microparticles or single-cells in isolation.1-3 Tuning the fluid oscillation frequency and amplitude allows these microeddy devices to trap a variety of objects such as micro-bubbles, T-cells, macrophage, and motile phytoplankton.1,4 Microeddies can be arrayed for high throughput trapping. Here we examine the statistics of trapping in microeddy arrays in order to combine tools for single particle analysis with population analysis. We present a method to rapidly determine overall cell counts and analyze sub-populations based on low resolution imaging the statistical behavior of trapping.
PDMS microchannels (~120 μm high and 1mm wide) were fabricated with an array of cylindrical posts 50 μm in diameter from a SU-8 master.2 The post arrays generate steady microeddy flows when piezo disks oscillate the fluid at frequencies in the range 2 - 20 kHz. Fluid displacement amplitudes are typically 1-3 μm. We used 10 μm particles as objects to trap, and 1 μm particles as tracers that showed the overall fluid motion.
Figure 1A shows the motion of 1 μm fluorescent particles as they circulate in the steady streaming flow field (5 kHz fluid oscillation). Under these same conditions, Figure 1B shows that 10 μm particles are trapped within the microeddies. Note that some traps have one or more particles while others have zero particles. Key information about the overall population and sub-populations of particles (if they exist) can be determined by analyzing the trapped distribution.
We postulated that trap-filling in the hydrodynamic tweezer arrays follows a Poisson distribution, where a particle is trapped by random, discrete, and independent events. Practically, this means that the physics of trapping the second or third particle is unperturbed by the existence of other particles in the trap. For Poisson statistics, the mean number of particles expected per trap is λ, and the probability that there are exactly n particles in any given trap is
P(n, λ) = λn e - λ/ n!
Figure 2 shows experimental data and best fit curves for the probability distribution P as a function of n for several concentrations of suspended particles. Determining this distribution requires high resolution imaging to unambiguously resolve the number of particles in each trap. We treat λ as an unknown used to fit the Poisson distribution (1), expecting it to be linear with microparticle concentration, as shown. The preliminary data shown here confirms that particle trapping obeys a Poisson distribution, at least in the small λ limit where traps with 3 or more particles are rare.
Knowledge that trapping follows a Poisson distribution facilitates quantitative analysis. For example, the probability for finding empty traps (n=0) is P (0, λ) = e-λ . Since one can easily determine P (0, λ) experimentally from low resolution imaging, one can find λ without best-fit to teh whole distribution. Figure 3 shows that simple empty trap counting provides a linear relationship between the actual particle concentration and the λ value calculated from P(0, λ). This low-resolution approach finding empty traps is fast and easy, and in the small λ limit, comparable in accuracy to more laborious measurements of the full distribution. In short, counting empty traps permits a fast "snapshot" method for total cell titre. Similarly, if m sub-populations are discernable at low resolution (i.e., if each population has a clearly different morphology or fluorescent color, etc), counting the traps where the color or morphology is absent will provide the sub-population titre by the same procedure as above.
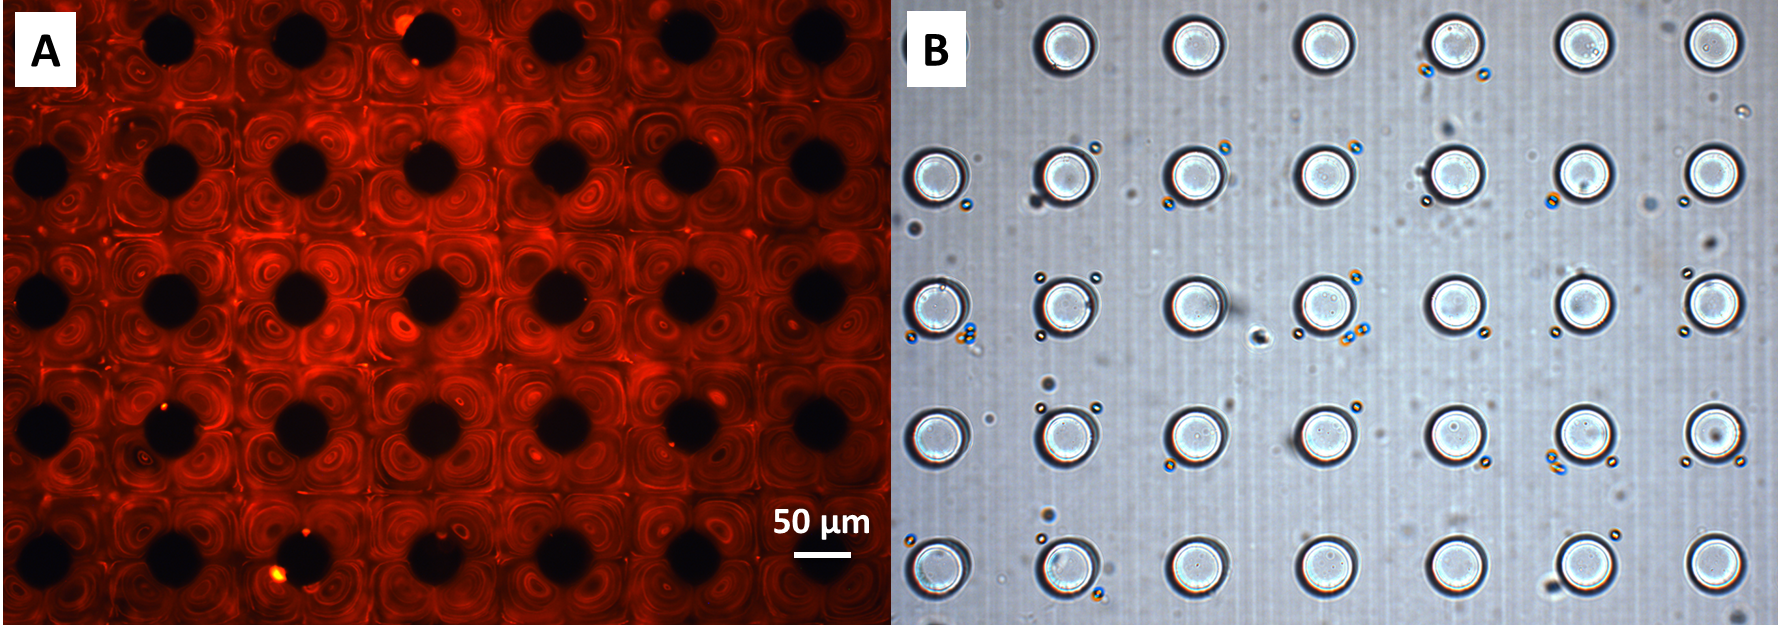
Figure 1: Image of 10μm polystyrene particles trapped in an array where each post generates 4 traps. Image analysis gives the numbers of particles in each trap. In this image, one sees traps that possess n = 0 (most common),1 (frequent),2(rare).
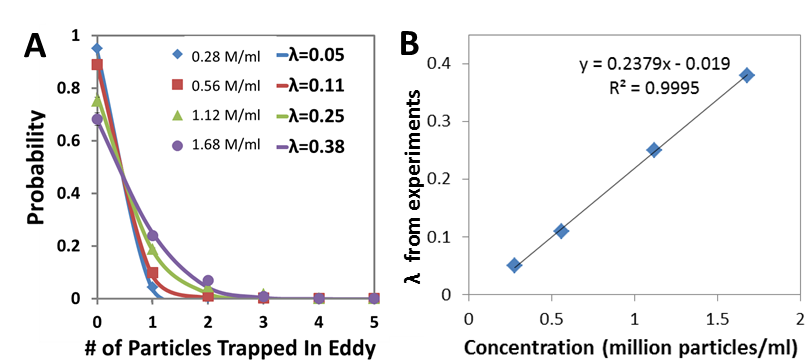
Figure 3: A) Fitted Poisson curve of experimental probability of particles trapped in eddys shows that within our small number of samples, trapping fallows Poisson distribution. B) Fitted experimental data shows that λ value increases linearly with the sample concentration.
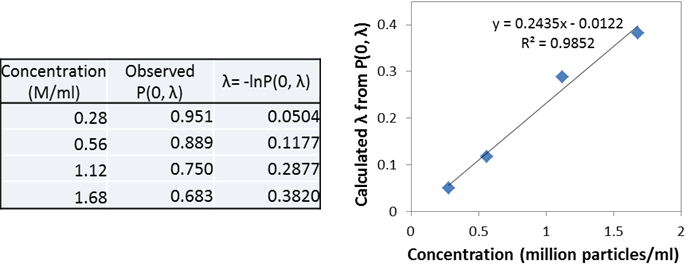
Figure 4: Calculated λ from experimental P(0, λ) values show linear relationship with the concentration of bulk samples, meaning that bulk concentration (total cell count) can be determined simply by knowing the observed numbers of empty traps.
References
1. Lutz, B.R., J. Chen, D.T. Schwartz, Hydrodynamic tweezers: 1. Noncontact trapping of single cells using steady streaming microeddies, Anal. Chem., 78(15), 5429-5435 (2006)
2. Lutz, B.R., J. Chen, D.T. Schwartz, Microscopic steady streaming eddies created around short cylinders in a channel: Flow visualization and Stokes layer scaling, Physics of Fluids, 17(2), 23601 (2005)
3. Lieu, V.L., T.A. House, D.T. Schwartz, Hydrodynamic tweezers: Impact of design geometry on flow and microparticle trapping, Anal. Chem., 84(4), 1963-1968 (2012)
4. Lieu, V.L., T.A. House, D.T. Schwartz, Microeddy design and application for sincel cell trapping and monitoring, 16th International Solid State Sensors, Actuators and Microsystems Conference (TRANSDUCERS 2011), Beijing (2011)
See more of this Group/Topical: 6th International Conference on Bioengineering and Nanotechnology