303263 Direct Observation of Particle Deposition in Membrane Feed Channels: Experiment and Model
Direct observation and modeling of particle deposition in membrane feed spacer channels
A.I. Radu 1, 2, M.S.H. van Steen 1, M.C.M. van Loosdrecht 1, C. Picioreanu 1
1 Department of Biotechnology, Faculty of Applied Sciences, Delft University of Technology, Julianalaan 67, 2628 BC Delft, The Netherlands
2 Wetsus, Centre of Excellence for Sustainable Water Technology, Agora 1, P.O. Box 1113, 8900 CC Leeuwarden, The Netherlands
Keywords: fouling; feed spacer; hydrodynamics; mathematical model
Introduction
Fresh water scarcity in several regions has led to an increased use of membrane processes for drinking and process water production from alternative sources (i.e., brackish water, seawater, wastewater). A major drawback for membrane processes is biofouling, associated with biofilm formation resulting in increased water production costs and decreased permeate quality. Deposition of bacteria in spiral wound membrane modules is an essential first step for biofilm formation. This work studied the deposition of polystyrene microspheres (mimicking bacterial cells) in membrane feed channels with net-shaped spacers, both experimentally and computationally.
Methods
Direct microscopic observation was used in a laboratory scale cross-flow system to follow particle deposition in time. Red spherical particles, neutrally buoyant, with a hydrophobic surface and a diameter of 2.5 µm were used as abiotic representation for bacterial cells. A transparent top flow cell fitted with commercial flat sheet nanofiltration membranes and feed spacers from spiral wound elements allowed in situ monitoring of deposition patterns. Various spacer geometries were tested in both ladder and diamond configurations at cross-flow velocities applied in practice (uin=0.05 - 0.2 m/s). A three-dimensional numerical model including fluid flow, particle trajectory calculations and particle attachment to membrane, glass and spacer surfaces was constructed. Model geometry was created based on scanning electron microscopy images of feed spacers used in the experiments.
Results and conclusions
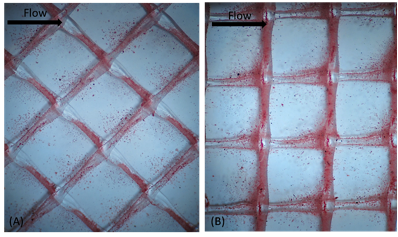
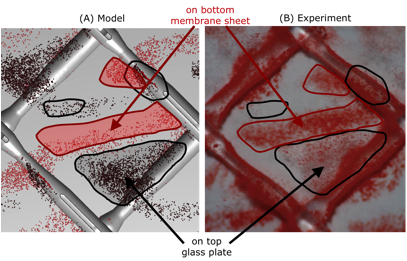
Experimental observations indicate that deposition occurs initially on the feed spacer filaments and later in specific zones on the membrane and top glass plate. The observed deposition patterns are strongly influenced by feed spacer orientation. Sixteen possible configurations for the diamond and ladder orientations, all resulted in different particle deposition patterns. The deposition prone areas identified within one representative spacer element are highly reproducible across the flow cell (Figure 1). Numerical simulations successfully describe the particle deposition patterns obtained in experiments for several geometries and different flow conditions (Figure 2). Uneven deposition on various surfaces is correlated with the non-symmetric nature of feed spacer filaments.
The remarkable agreement between simulated and experimentally observed deposition patterns emphasizes the importance of feed spacer geometry and thus hydrodynamic conditions for particle deposition.
Optimization of spacer geometry is a potential way to reduce fouling. The numerical model developed in this work could serve as an initial screening tool for assessing strengths and weaknesses of newly proposed feed spacer geometries. Results obtained in this study are expected to have important practical applications for predicting early stage fouling.
|
|
Figure 1. Observed particle deposition pattern after 4h on the membrane, glass and spacer surface: (A) diamond and (B) ladder spacer configurations. The pattern is reproducible across the flow cell for a given feed spacer geometry and orientation. 16 such possible configurations were investigated.
| Figure 2. Particle deposition patterns after 20h for one possible configuration of the diamond spacer: numerical model results (left) and in-situ visual observation of the feed spacer channels (right). The deposition regions are highlighted with contours of different colors: black=top glass; red=membrane. Flow direction is from left to right for both model and experiment.
|