
Why is it that after twenty five (25) years of the establishment of a good performance standard as “Process Safety Management” (PSM) the industry still experiencing incidents?
This answer to this question is as simple or as complicated as we want it to be. The implementation of Process Safety Management (PSM) standard is simple. It is a performance standard and as such each facility or company decides how it will be implemented within the definition of the regulation. The problem resides in the way, on how good is the PSM performance before a major accident or any incident. The complication comes in when there is a need to measure how good the implementation of the PSM requirements is. A lot of facilities or companies might not hold back and say “we are good”, “we do not have process safety incidents” until reality hits and there is a catastrophe that affects the life, health, environment and future of their organization.
In principle everything is good, if at the end of the year there is not a major incident and there is not an apparent general public knowledge of a performance that could lead to a major event. But, how good is the day to day operation and performance? Is there no incidents because indeed there is a good performance or there is not an incident because the combination of elements is not lined-up yet to that critical point that defines an undesirable event?
That significant day when a major release, fire, or explosion might come can be prevented from catching up to our personnel by measuring and modifying performance that is molded within the organizational structure (refer to PSM organization chart – figure no. 1) and by the behaviors of the personnel that carry out the procedures set to prevent incidents.
How are the performance and the behavior that prevent incidents?
If performance can be defined as; “accomplishment of a given TASK MEASURED AGAINST PRESET STANDARDS OF ACCURACY, COMPLETENESS, cost, and speed” (1); How performance could be measured? If you measure behavior (action or lack of action against a standard) we measure performance. Therefore, any organization that determines the completeness of a task measures the behaviors that give the indication of performance. The organizational performance is up to standard and it is said that it is good behavior when a task is completed as per established policies, procedure, and regulatory requirements.
Every company establishes standards, policies and procedures that are filled with good executable actions with the intention to guide the culture towards an incident free environment. The question is: Are we measuring and / or tracking the behaviors to reduce the risk and eliminate incidents?
The execution of the procedures is one major factor that needs to be taken in consideration to measure the organization’s PSM efficiency or success.
If an organization measures the behavior by means of measuring the degree of proficiency in executing the established procedures, then that organization measures the degree of commitment that exist within their personnel, at all levels of the organization. Then corrective actions can be taken to improve performance and the environment towards an incident free culture – environment.
In order to define how efficient PSM program is, there is a need to determine if the established procedures and practices are being implemented, partially implemented or not implemented at all. The Key Behavior Indicators will define quantitatively at what level of application the procedures are.
Taking as a basis that the purpose of the established procedures are to sustain an operation with the ultimate goal of being successful and prevent incidents, the KBI – Index (refer to figure no. 2) will indicate how close the organization is towards 100 % successful goal.
PSM GOAL
TO BE EFFECTIVE, EFFICIENT AND MAINTAIN AN INCIDENT FREE ORGANIZATION.
KBI GOAL
MEASURE THE DEGREE OF PSM EFFICIENCY AND STIMULATE CORRECTIVE ACTIONS TO
REACH AN INCIDENT FREE ORGANIZATION.
KEY BEHAVIOR INDICATOR – INDEX PROCESS
The KBIs -Key Behavior Indicators numerical value will:
A. Identify measure and report the behavior or level of execution of the established procedures.
B. Provide the opportunity to work on the identified items that are not executed as expected.
C. Provide the opportunity to work on the items that are not up to the standard of performance defined by the organization.
Each organization and group within starts with a perfect, 100%, KBI Index, efficiency. Deviations from proper execution of procedures indentify the areas of concern that each member of the organization needs address to improve. Some of the parameters that define a good process safety management system are the proper execution of MOCs, PHAs, safe work practices, recommendation resolutions, audits, inspections and training among others. The application of these parameters can be measured and tracked.
If the KBI – INDEX is high it might by an indication that the parameters selected have been mastered and could be replaced by new ones that are of concern.
If the “KBI - INDEX” is low the organization has the opportunity take a closer look and define the behaviors that do not allow a good performance.
The key behavior indicator parameters are dynamic, once an indicator is controlled and the organization has maintained performance it could be maintained in the matrix or replace by another activity that requires monitoring and or improvement. Each organization must define the behavior that are of major concerns that have the potential to lead to a major incident.
The selection of the parameters (KBIs) must be based on the potential risk that might result in catastrophic release or incidents. Must keep in mind that normally a combination of the selected parameters when are not properly executed are contributing factors that lead into incidents.
The result of the KBI program is the continuous improvement in efficiency due to a standardized identification, monitoring and correction of incident precursors.
The following tables shown as examples provide a way to measure how well is a PSM program.
Figure no. 1
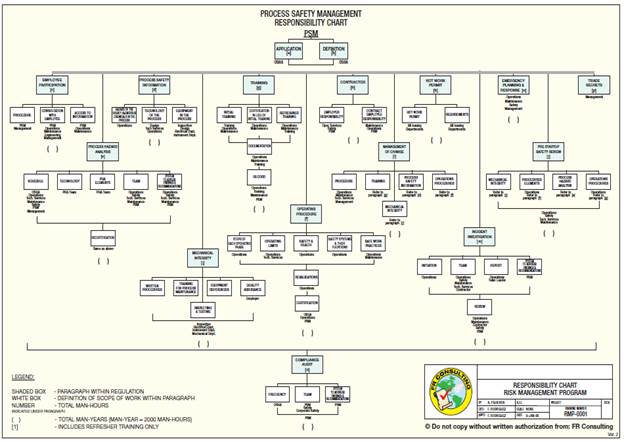
Figure no 2.
PROCESS OPERATIONS – Key Behavior Indicators –Index
KEY BEHAVIOR INDICATOR - KBI
| Unit
| Area
|
|
| COMMENTS
| Weight
| Score
| ||
|
| Target
| April
| May
|
|
| equat
| ||
PHA
|
|
| |||||||
Revalidation Total Months Behind Schedule
| %
|
| *
| *
|
| 3.70
|
| ||
Rec. (PSM – RMP) Past Due Implementation
| No
| 0
|
| 34
|
| 3.70
| .11
| ||
Recommendations (PSM/RMP) To Be Schedule
|
|
|
| 2
|
| 3.70
|
| ||
1st Revalidation Review With Employees Completed | 5
| 100
|
| 44
|
| 3.70
| 1,63
| ||
2nd Revalidation Review With Employees Completed
| %
| 100
|
| **
|
|
|
| ||
INCIDNETS
|
|
| |||||||
PSM Investigations Open – PSM /RMP/ Env. | No.
| 0
|
| 25
|
| 3.70
| 0.14
| ||
Incident Review With Employee Complete | %
| 100
|
| 85
|
| 3.70
| 3.15
| ||
Rec. To Be Schedule | No.
| 0
|
| 64
|
| 3.70
| 0.06
| ||
Rec. Past Due Implementation | No.
| 0
|
| 7
|
| 3.70
| 0.46
| ||
Process Investigations Open | No
| 0
|
| 47
|
| 3.70
| 0.08
| ||
Rec. Past Due Implementation | No
| 0
|
| 0
|
| 3.70
| 3.70
| ||
Rec. To Be Scheduled | No
| 0
|
| 54
| DO NOT COPY OR DUPLICATE WITHOUT WRITTEN AUTHORIZATION FROM FR CONSULTING LLC MANAGEMENT
| 3.70
| 0.07
| ||
Safety Investigations Open | No
| 0
|
| 7
|
| 3.70
|
| ||
Rec. Past Due Implementation | No
| 0
|
| 1
|
| 3.70
|
| ||
Rec. To Be Scheduled | No
| 0
|
| 10
|
| 3.70
|
| ||
Incidents Without Report
| No
| 0
|
| 0
|
| 3.70
|
| ||
MOC
|
|
| |||||||
In Service Without Documentation
| No
| 0
|
| 0
|
| 3.70
|
| ||
Temporary MOC Past Due Removal
| No
| 0
|
| 4
|
| 3.70
|
| ||
Outstanding PSSR Items
| No
| 0
|
| 6
|
| 3.70
|
| ||
PROCEDURES
|
|
| |||||||
Annual Recertification Past Due
| No.
| 0
|
| 0
|
| 3.70
|
| ||
Training - % Completed
| %
| 100
|
| 50
|
| 3.70
|
| ||
AUDITS
|
|
| |||||||
Work Permit & PSM Covered Entry Efficiency | %
| 100
|
| 97
|
| 3.70
|
| ||
Work Permit Properly Issued ( General & Hot Work)
| %
| 100
|
| 94
|
| 3.70
|
| ||
Hot Work Permit Properly Issued (Technical Section) | %
| 100
|
| 100
|
| 3.70
|
| ||
Lock Out /Tag out Permits - Overall Efficiency | %
| 100
|
| 97
|
| 3.70
|
| ||
Flange Tightening Audit
| %
| 100
| N/A
| N/A
|
| 3.70
|
| ||
Turnover Equipment Audit
| %
| 100
| N/A
| N/A
|
| 3.70
|
| ||
Refinery Audit Items Past Due Implementation | No.
| 0
| --
| --
|
| N/A
|
| ||
KBI Index 56.7%
DO NOT COPY WITHOUT WRITTEN AUTHORIZATON FROM FR CONSULTING LLC MANAGEMENT”
Figure no. 2 (cont.)
CONTRACTOR NAME
PSM/SAFETY/FIRE/MEDICAL/SECURITY -- KEY BEHAVIOR INDEX – KBI (FCR-CR) Period ending ___
Item
| KBI
| Unit
| Area
|
| Comments
| wght
| Score
| |||
|
|
| Target
| April
| May
|
| %
| Equa.
| ||
| INCIDENTS
|
| %
| |||||||
1
| Contractor: Investigations open 2 weeks after date of incident
| No.
| 0
|
| X
|
| 4.00
| 2.00
| ||
2
| · Recommendations to be Scheduled
| No.
| 0
|
|
|
| 4.00
| 4.00
| ||
3
| · Rec. Past Due Implementation
| No.
| 0
|
|
|
| 4.00
| 4.00
| ||
4
| · Rec. Past Due second re-schedule | No.
| 0
|
|
|
| 4.00
| 4.00
| ||
5
| Lesson Learned - Outstanding | No.
| 0
|
| X
|
| 4.00
| 2.00
| ||
6
| Lessons learned Reviewed with Employees ( 1 week) | %
| 100
|
|
|
| 4.00
| 4.00
| ||
| MOC
|
|
| |||||||
7
| In service without or incomplete Documentation
| No.
| 0
|
|
|
| 4.00
| 4.00
| ||
8
| Temporary MOC Past Due removal
| No.
| 0
|
|
|
| 4.00
| 4.00
| ||
| TRAINING
|
|
| |||||||
9
| Special Training - % Completed
| %
| 100
|
|
|
| 4.00
| 4.00
| ||
10
| Training - % Completed
| %
| 100
|
|
|
| 4.00
| 4.00
| ||
| AUDITS
|
|
| |||||||
11
| Work Permit & PSM Covered Entry & Field Execution Efficiency | %
| 100
|
| X
|
| 4.00
| 3.72
| ||
12
| Work Permit Properly Issued ( General & Hot Work)
| %
| 100
|
| X
|
| 4.00
| 3.83
| ||
13
| Hot Work Properly Issued ( Technical Section ) | %
| 100
| DO NOT COPY OR DUPLICATE WITHOUT WRITTEN AUTHORIZATION FROM FR CONSULTING LLC MANAGEMENT
| X
|
| 4.00
| 3.94
| ||
14
| Lockout/Tag out Permits – Field Execution Efficiency | %
| 100
| N/A
| N/A
|
| 4.00
| 4.00
| ||
15
| Flange Tightening Audit | %
| 100
| N/A
| N/A
|
| 4.00
| 4.00
| ||
16
| Turnover Equipment Audit
| %
| 100
| N/A
| N/A
|
| 4.00
| 4.00
| ||
17
| Contractor Audit Items To Be Schedule
| No.
| 0
|
|
|
| 4.00
| 4.00
| ||
18
| Contractors Audit Items Past Due Implementation
| No.
| 0
|
|
|
| 4.00
| 4.00
| ||
19
| Contractor Audits Items Past Due Second Reschedule | No.
| 0
|
|
|
| 4.00
| 4.00
| ||
| SAFETY
|
|
| |||||||
20
| Safety Meeting Participation
| %
| 100
|
|
|
| 4.00
| 4.00
| ||
21
| Annual Compliance Training Completed – Safety Day
| %
| 100
|
|
|
| 4.00
| 4.00
| ||
22
| Housekeeping
| %
| 100
|
|
|
| 4.00
| 4.00
| ||
| FIRE
|
|
| |||||||
23
| Water Gel Blanket Weekly Survey Completed - Operations | %
| 100
| N/A
| N/A
|
| 4.00
| 4.00
| ||
24
| Fire Monitor Survey Completed- Operations | %
| 100
| N/A
| N/A
|
| 4.00
| 4.00
| ||
25
| Fire Water Hose Reel Survey Completed - Operations
| %
| 100
| N/A
| N/A
|
| 4.00
| 4.00
| ||
| MEDICAL
|
|
| |||||||
26
| Hearing Test Completed
| %
| 100
|
|
|
| 4.00
| 4.00
| ||
27
| Pulmonary Testing Completed | %
| 100
|
|
|
| 4.00
| 4.00
| ||
28
| Fit Test Completed
| %
| 100
|
|
|
| 4.00
| 4.00
| ||
29
| CPR/ First Aid Training Completed
| %
| 100
|
|
|
| 4.00
| 4.00
| ||
30
| Blood Borne Pathogens Training Completed
| %
| 100
|
|
|
| 4.00
| 4.00
| ||
| TRAFFIC INFRACTION
|
|
| |||||||
31
| Traffic Tickets
| No
| 0
|
|
|
| 4.00
| 4.00
| ||
KBI Index 98.5%
In order to set up a Key Behavior Indicator and Index process to measure the true PSM performance the organization must follow a simple process as follows:
PROCESS SET - UP
KBI – INDEX PROCESS SET UP AND IMPLEMENTATION STEPS (Simplified Version)
I. MANAGEMENT
A. Decide to measure performance
B. Request the set up of a charter
C. Define sponsoring department
II. CHARTER ( Chaired by Sponsoring Department)
A. Identify with stakeholders Key Behavior Indicators
1. Measurable
2. Non-measurable
B. Identify sources of data
C. Define tracking matrix
III. STAKEHOLDERS
A. Review KBI Matrix
B. Agree to KBIs
IV. CHARTER
A. Seek roll – out management approval
B. Modify matrix if necessary upon management review
V. MANAGEMENT
A. Approval to roll-out and implementation
VI. STAKEHOLDER
A. Training personnel on KBI purpose and definitions
B. Support process
VII. SPONSORING DEPARTMENT
A. Collect data
1. this can be set electronically, normally is already in place
B. Develop matrix and publish it to the organization.
VIII. STAKEHOLDERS
A. Present KBI and Index to Management in a public setting
B. Provide action plan with KBI presentation
Notes:
1. Develop items VII and VIII on a monthly basis.
2. Review and Modification of KBI Matrix is done upon request of the sponsoring department stakeholders and or directive from management.
3. Management has the prerogative to add, delete matrix line items (KBIs)
4. Modifications to the matrix require review through steps II to VIII
CONCLUSION
The KBI process can be applied to every department within any organization including Management, Operations, Engineering, Maintenance, Safety, PSM, Safety, Accounting and Others to measure their PSM implementation performance. KBIs provide an indication of commitment, discipline, desire to improve compliance and / or minimize, if not eliminated incidents probabilities. This process outlines and define that what is measured and publicly acknowledge gets corrected, if needs correction.

See more of this Group/Topical: Global Congress on Process Safety