

Material Distribution of Gas-Solid Fluidized Beds Measured by Electrical Capacitance Tomography - a Big-Data Perspective
Gas-solid fluidized beds are used in many industrial processes, such as coal gasification, power generation, granulation, and polymerization. To measure hydrodynamic characteristics of gas-solid fluidized beds, numerous intrusive and non-intrusive experimental techniques have been developed. The intrusive methods like optical probe, capacitance probe, and pressure measurement are easy to implement but only capable of providing local information concerning the fluid flow. While the non-intrusive techniques such as tomography can be used to visualize the entire flow field without causing any disturbance to the flow. Compared to other industrial process tomography techniques, Electrical Capacitance Tomography (ECT) shows advantages in terms of fast imaging speed, no radiation, robustness, and low cost. Moreover, considering the non-conductive nature of materials in gas-solid fluidized beds, ECT is a suitable measuring technique for hydrodynamic investigation of these reactors.1
In ECT, the sensing electronics measure variations in capacitance between pairs of electrodes, which are placed around the periphery of a pipe or vessel under investigation. These measurements are then used to reconstruct the cross-sectional permittivity distribution as a presentation of the material distribution inside the sensing area via a specific image reconstruction algorithm. However, two major difficulties are associated with the reconstruction process. First, the number of measured independent capacitance data is far less than the number of unknown image pixels, and therefore the problem is severely under-determined. Secondly, due to the ill-posed and ill-conditioned property of the reconstruction process, the reconstructed results are sensitive to raw capacitance measurement noise. To address these problems, different reconstruction techniques, including single-step and iterative algorithms, have been proposed and have been reviewed by Yang and Peng2 and Cui et al.3
Although big progress has been made in the image reconstruction with ECT in the last two decades to improve the image quality, i.e., the accuracy of material distribution measurements, the correlation coefficient between the true image and reconstructed image by a certain technique is usually lower than 0.9. This apparently hiders ECT as an excellent technique for gas-solid fluidized beds measurements, especially when a direct comparison between ECT measurements and Computational Fluid Dynamics (CFD) simulations is needed, in which high-accuracy images are necessary.
In the last several years, big-data analysis has gained considerable attention and momentum in both academia and industry, and also see some applications in the field of chemical engineering.4 The dynamic evaluation method, which we have proposed recently,5 provides a way for image reconstruction with ECT using a big-data perspective, and is potential to improve the image quality greatly.
To meet different needs, the big-data image reconstruction method is categorized to two schemes: an on-line scheme and an off-line scheme. The procedure of the on-line scheme is as follows. First, CFD simulations of a gas-solid fluidized bed, which is the same as that used in experiments, are performed. Next, a generic sensitivity matrix is obtained from a probability distribution analysis carried out on the material distributions extracted from the CFD simulation results. Finally, material distributions in experiments can be obtained using the modified Tikhonov regularization method equipped with the generic sensitivity matrix. While the off-line scheme is due to fingerprint matching the normalized capacitance between CFD simulations and experiments. As an illustration, Figure 1 shows some typical results obtained by different image reconstruction algorithms and the second-scheme big-data method. As can be seen, the correlation coefficients obtained by the existing image reconstruction algorithms are all lower than 0.9, also some details especially on the boundary between bubble and emulsion phases are blurred. While the best image can be obtained by the big-data method with the correlation coefficient as high as 0.95.
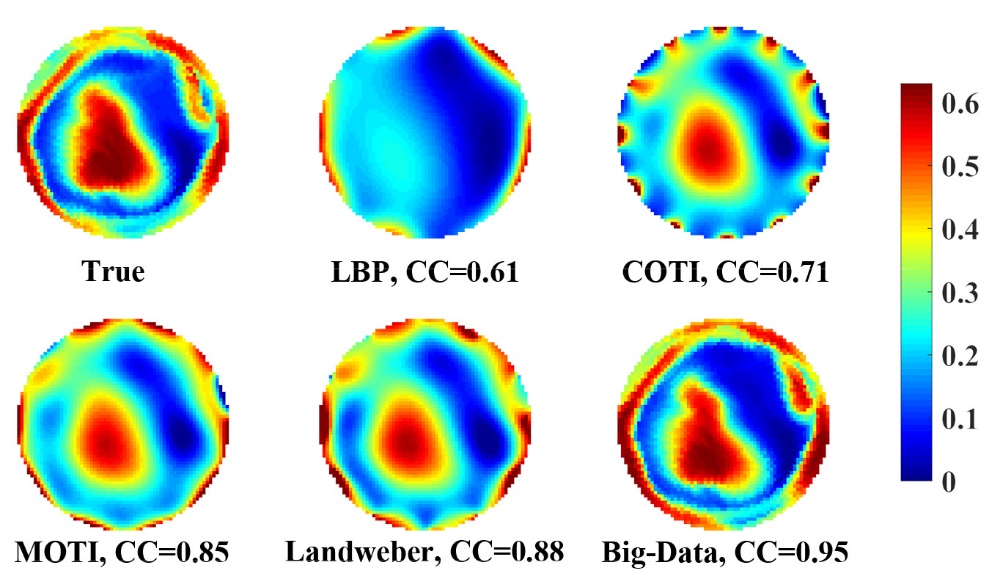
Figure 1. Material distribution reconstructed by different image reconstruction algorithms and the second-scheme big-data method.
Literature Cited
1. Rasel RK, Zuccarelli CE, Marashdeh QM, Fan L-S, Teixeira FL. Towards multiphase flow decomposition based on electrical capacitance tomography sensors. IEEE Sens J. 2017;in press.
2. Yang WQ, Peng LH. Image reconstruction algorithms for electrical capacitance tomography. Meas Sci Technol. 2003;14:R1-R13.
3. Cui ZQ, Wang Q, Xue Q, Fan WR, Zhang LL, Cao Z, Sun BY, Wang HX, Yang WQ. A review on image reconstruction algorithms for electrical capacitance/resistance tomography. Sens Rev. 2016;36:429-445.
4. Qin SJ. Process data analytics in the era of big data. AlChE J. 2014;60:3092-3100.
5. Guo Q, Meng SH, Wang DH, Zhao YF, Ye M, Yang WQ, Liu ZM. Investigation of gas-solid bubbling fluidized beds using ECT with a modified Tikhonov regularization technique. AlChE J. 2017;in press.
See more of this Group/Topical: Fluidization & Multiphase Flow