
Recently, the advent of new single-cell profiling technologies have provided a promising means to elucidate the mechanisms regulating dynamic cellular processes, including cell development, maturation, and differentiation (Trapnell, 2015; Paul et al., 2015; Richard et al., 2016). In particular, conventional techniques for the generation of transcriptomics data such RNA-sequencing and real-time quantitative PCR have been successfully adapted for the quantification of gene expression levels in individual cells (Tang et al., 2009; White et al., 2011). Single cell analysis allows us to study the significance of cell-to-cell heterogeneity, which would be impossible using population-averaged measurements (Sandberg, 2013). Single cell profiling technologies are now able to provide high-throughput (many cells) high-dimensional (many genes) expression data in a single experiment, pioneering a whole new series of computational methods for the data analysis. In this context, the identification and characterization of different cell types within a heterogeneous population is an important step in the analysis of single-cell data (Liu and Trapnell, 2016), which may lead to new insights on the underlying biological process. Standard unsupervised clustering strategies such as k-means (Kanungo et al.) and hierarchical clustering (Johnson, 1967) have previously been applied. However, the high variability in gene expression patterns and the high dimensionality of the data make the clustering problem not trivial. In recent years, different clustering strategies have been developed specifically for single-cell expression data by modifying traditional clustering algorithms and/or by using dimensional reduction techniques (Lin et al., 2017; Xu and Su, 2015; Buettner et al., 2015; žurauskienė and Yau, 2016; Kiselev et al., 2017). In addition, time-variant cell clustering methods have been implemented to elucidate the appearance of cell types in cell differentiation stages (Marco et al., 2014; Huang et al., 2014). Until recently (Ezer et al., 2016), the bursty and stochastic dynamics of gene expression in single cells, which has been suggested as a major source of the variability (K¾rn et al., 2005), were not directly addressed in the clustering of single cell transcriptomics data.
In this work, we implemented a clustering algorithm that explicitly takes into account the stochastic dynamics of gene transcriptional process using the two-state model (Kim and Marioni, 2013). The two-state model describes the gene expression processes involving (1) the promoter switching between ON and OFF state, (2) in the OFF state (a closed chromatin state), the gene is not accessible for the transcription and (3) in the ON state (an open chromatin state), the gene transcription could occur, producing the mRNA molecules in bursts (Munsky et al., 2012). A total of four kinetic parameters fully describe the two-state model, namely Kon (rate of activation), Koff (rate of inactivation), Kt (rate of transcription) and Kd (rate of degradation). Our clustering approach is based on the idea that cells belonging to the same cluster should share the same parameters of the two-state model. This concept has been recently illustrated by Ezer et al. in the implementation of their single cell clustering method called SABEC (Simulated Annealing for Bursty Expression Clustering) (Ezer et al., 2016).
Our clustering method starts by randomly assigning cells into clusters, and iteratively reassigns cells to clusters until convergence or until a maximum number of iterations, as follow: (1) for each cluster and each gene, determine the parameters for the two-state model that best fit the distribution of expression among cells in the cluster, (2) calculate the probability (likelihood) for each cell to be in each of the clusters given the cellÕs gene expression data and the cluster parameters from step (1), and (3) re-assign cells to the cluster that gives the maximum likelihood for the cellÕs gene expression data. To improve both the accuracy and stability of the solutions, we performed the iterations above multiple times with different initial cell assignments, and combine the outcomes in a consensus matrix that summarize how often two cells are clustered together (Fig. 1). Finally, we implemented k-medoids (Bhat, 2014) using the consensus matrix to obtain the cell clustering. The number of clusters can be user-defined or automatically evaluated based on heuristic approaches such as gap-statistics or silhouette scores. In comparison to SABEC (Ezer et al., 2016), the greedy optimization in our algorithm converged much faster (seconds vs. minutes) while producing comparable clustering results. For example, in an application to single-cell expression data from hematopoietic stem cell (HSC) differentiation (Moignard et al., 2013), each repeat of SABEC took 45 minutes to complete on a standard workstation, while our greedy algorithm converged to the final solution in less than one minute.
In the next step, we employed the cell clustering outcome for two different tasks: (1) to define the trajectory of gene expression that describes the cell differentiation progression, and (2) to infer the gene regulatory networks that govern the cell differentiation process. In these two tasks, we viewed each of the clusters as a ÒstateÓ in the cell differentiation. In the first task, we first define the cell state of each cluster based on prior information of either the division stages or the time stamps of the cells in the cluster. For each cell, we used the two-state model to compute the cell pseudo-stage or pseudo-time, specifically by taking a weighted average of the cluster states with the log-likelihood values of the cell to be in any given cluster as the weights. The cell trajectory was finally constructed by ordering cells according to their pseudo-stage or pseudo-time.
In the final task, we employed the cluster and cell trajectory to portray the cell differentiation progression, and inferred the gene regulatory network that governs this process. More specifically, we employed our previous algorithm, SINCERITIES (Papili Gao et al., 2016), on the ordered cells. Briefly, SINCERITIES is able to reconstruct the (causal) gene-gene regulations by employing regularized linear regression, based on changes in the distributions of gene expressions over the differentiation trajectory. Meanwhile, the signs/modes of the gene regulations (activation and repression) are inferred by computing partial correlation analysis between pairs of genes. . We demonstrated the efficacy of our algorithms for single cell clustering, cell trajectory construction and gene regulatory network inference on the differentiation of chicken erythrocytic cells (Richard et al., 2016). The results further confirmed the importance of sterol pathways in initiating the cell differentiation process in this particular cell line.
References
Bhat,A. (2014) K-MEDOIDS CLUSTERING USING PARTITIONING AROUND MEDOIDS FOR PERFORMING FACE RECOGNITION. Int. J. Soft Comput. Math. Control, 3.
Buettner,F. et al. (2015) Computational analysis of cell-to-cell heterogeneity in single-cell RNA-sequencing data reveals hidden subpopulations of cells. Nat. Biotechnol., 33, 155–160.
Ezer,D. et al. (2016) Determining Physical Mechanisms of Gene Expression Regulation from Single Cell Gene Expression Data. PLOS Comput. Biol., 12, e1005072.
Huang,W. et al. (2014) Time-variant clustering model for understanding cell fate decisions. Proc. Natl. Acad. Sci. U. S. A., 111, E4797-806.
Johnson,S.C. (1967) HIERARCHICAL CLUSTERING SCHEMES. Psychometrika, 32.
K¾rn,M. et al. (2005) Stochasticity in gene expression: from theories to phenotypes. Nat. Rev. Genet., 6, 451–464.
Kanungo,T. et al. An Efficient k-Means Clustering Algorithm: Analysis and Implementation.
Kim,J. and Marioni,J.C. (2013) Inferring the kinetics of stochastic gene expression from single-cell RNA-sequencing data. Genome Biol., 14, R7.
Kiselev,V.Y. et al. (2017) SC3: consensus clustering of single-cell RNA-seq data. Nat. Methods.
Lin,P. et al. (2017) CIDR: Ultrafast and accurate clustering through imputation for single-cell RNA-seq data. Genome Biol., 18, 59.
Liu,S. and Trapnell,C. (2016) Single-cell transcriptome sequencing: recent advances and remaining challenges. F1000Research, 5.
Marco,E. et al. (2014) Bifurcation analysis of single-cell gene expression data reveals epigenetic landscape. Proc. Natl. Acad. Sci. U. S. A., 111, 5643–50.
Moignard,V. et al. (2013) Characterization of transcriptional networks in blood stem and progenitor cells using high-throughput single-cell gene expression analysis. Nat. Cell Biol., 15, 363–72.
Munsky,B. et al. (2012) Using Gene Expression Noise to Understand Gene Regulation. Science (80-. )., 336.
Papili Gao,N. et al. (2016) SINCERITIES: Inferring gene regulatory networks from time-stamped single cell transcriptional expression profiles. bioRxiv.
Paul,F. et al. (2015) Transcriptional Heterogeneity and Lineage Commitment in Myeloid Progenitors. Cell, 163, 1663–1677.
Richard,A. et al. (2016) Single-Cell-Based Analysis Highlights a Surge in Cell-to-Cell Molecular Variability Preceding Irreversible Commitment in a Differentiation Process. PLOS Biol., 14, e1002585.
Sandberg,R. (2013) Entering the era of single-cell transcriptomics in biology and medicine. Nat. Methods, 11, 22–24.
Tang,F. et al. (2009) mRNA-Seq whole-transcriptome analysis of a single cell. Nat. Methods, 6, 377–382.
Trapnell,C. (2015) Defining cell types and states with single-cell genomics. Genome Res., 25, 1491–8.
White,A.K. et al. (2011) High-throughput microfluidic single-cell RT-qPCR. Proc. Natl. Acad. Sci. U. S. A., 108, 13999–4004.
Xu,C. and Su,Z. (2015) Identification of cell types from single-cell transcriptomes using a novel clustering method. Bioinformatics, 31, 1974–80.
žurauskienė,J. and Yau,C. (2016) pcaReduce: hierarchical clustering of single cell transcriptional profiles. BMC Bioinformatics, 17, 140.
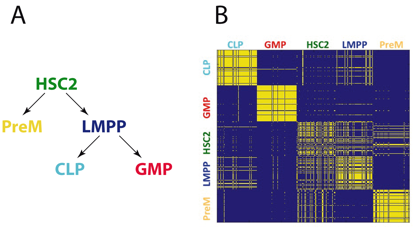
Figure 1: Cell clustering in HSC differentiation using single cell transcriptional expression data. (a) The single cell expression data came from five populations of cells during hematopoiesis: LMPP (lymphoid-primed multipotential progenitor), PreM (premegakaryocytes), GMP (granulocyte-macrophage progenitor) and CLP (common lymphoid progenitors). (b) Maximum-likelihood based clustering of cells with our greedy algorithm.
See more of this Group/Topical: Food, Pharmaceutical & Bioengineering Division